

SHORT-TERM (today and 5 days out)
For Thursday, 2158.25 can contain selling into later next week, above which 2189.00 is expected over this time horizon. Upside today, 2175.25 can contain initial strength, while pushing (especially opening) above 2175.25 allows 2189.00 intraday, able to contain buying into later next week and the level to settle above for yielding the targeted 2228.25 formation over the same time horizon. Downside Thursday, breaking/opening below 2158.25 allows 2145.00 intraday, while closing today below 2158.25 indicates 2119.00 within 3-5 days, able to contain selling through August activity and above which 2228.25 remains a 3-5 week objective.
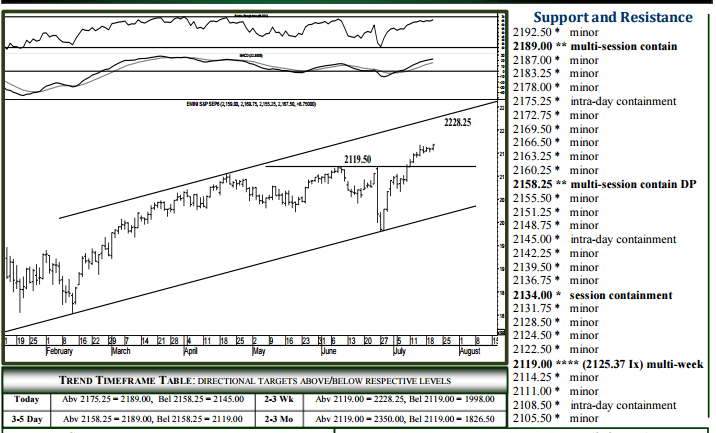
NEAR (2-3 wks) and LONG TERM (2-3 MO+)
The 2119.00 region (2125.37 Index – page 2) can absorb selling into later year, above which 2228.25 remains a 3-5 week target, 2350.00 attainable by the end of the year. Upside, 2228.25 should contain monthly buying pressures when tested, with a settlement above 2228.25 maintaining an accelerated upside pace into Q4, 2350.00 then expected over the following 5-8 weeks where the market can top out well into 2017. Downside, a daily settlement back below 2119.00 would be considered a failed long-term buy signal, essentially a valid sell signal into early August, 1998.00 then considered a 2-3 week target able to contain selling into September and a meaningful downside tipping point into later Q3.
To receive a two week free trial of the Daily Futures Letters and Monthly Futures Wrap, CLICK HERE

