

Our post in early June about the DAX showed how the index might erase four years of growth during its next declining phase. However it is still too soon to be certain about the character of the decline – whether it will consist of a series of overlapping three-wave moves or will instead take an impulsive (non-overlapping) five-wave form.
As a rule of thumb, the target of a retracement after coming out of a triangle is a retest of the middle area of the same triangle. In this case, it suggests that the DAX should have the area around 5,000 to 6,000 as longer-range target.
For now, we are provisionally forecasting that the decline will have a lot of overlap. However, if the decline turns out to be impulsive, then we might have to revise the ultimate target to a lower area.
Regardless of the nature of the larger downward pattern, there is not much practical distinction between the alternatives in terms of how the next trade will work out. There are three main things a potential short trader should keep in mind:
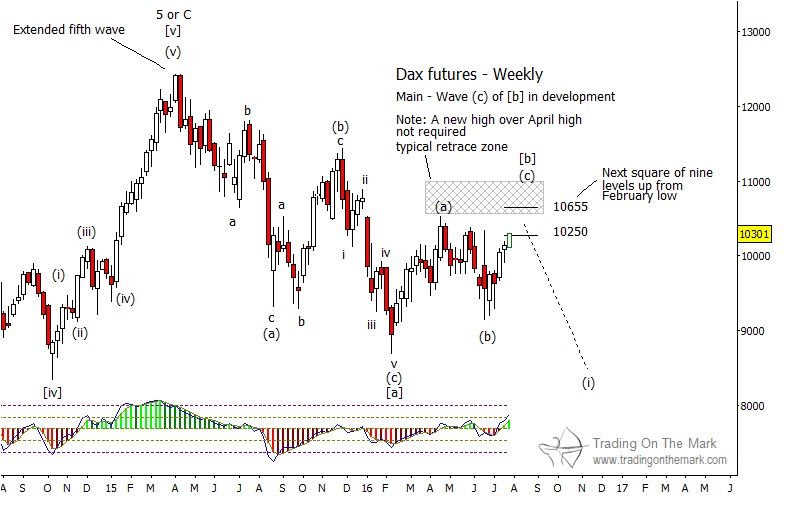
- In the larger picture (based on an updated monthly chart, not shown here), wave [b] should find resistance somewhere near the target box we have drawn between 10,570 and 11,000.
- At a finer level of detail (weekly chart), the Gann square-of-nine resistance near 10,655 looks like an attractive target for sub-wave (c) of [b], before the index resumes its decline.
- There is a sneaky resistance level to watch near 10,250, which could put an early halt to sub-wave (c) of [b], and the decline could start from there.
Our latest email bulletin shows more detailed Elliott wave counts on weekly charts for this and other European stock indices. You can request your copy via this link.

