

SHORT-TERM (today and 5 days out)
For Thursday, both 2166.75 and 2158.75 can firmly contain intraday activity, beyond which the next notable level is expected intraday. Downside today, breaking/opening below 2158.75 signals 2149.00, able to contain selling through Friday and above which the 2186.75-88.75 region remains a 3-5 day target. A settlement today below 2149.00 indicates a good weekly high, bearish continuation over the next 3-5 days then expected into the 2118.50 region where the market should bottom out through August trade – above which 2232.00 remains a 3-5 week objective. Upside today, pushing/opening above 2166.75 signals 2176.25, able to contain session strength. Closing above 2176.25 indicates the 2186.75-88.75 region tomorrow where the market can top out through next week as well as being a meaningful upside continuation point into mid-August activity
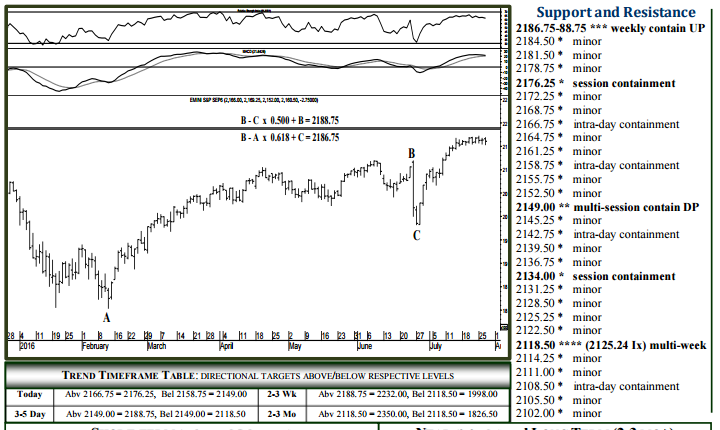
NEAR (2-3 wks) and LONG TERM (2-3 MO+) The 2118.50 region (2125.30 Index – page 2) can absorb selling into later year, above which 2232.00 remains a 3-5 week target, 2350.00 attainable by the end of the year. Upside, 2232.00 should contain monthly buying pressures when tested, with a settlement above 2232.00 maintaining an accelerated upside pace into Q4, 2350.00 then expected over the following 5-8 weeks where the market can top out well into 2017. Downside, a daily settlement back below 2118.50 would be considered a failed long-term buy signal, essentially a valid sell signal into later August, 1998.00 then considered a 2-3 week target able to contain selling through September and a meaningful downside tipping point into Q4.

