We’ve been watching the soybean market closely for signs of a top as we felt that the early summer rally had become overly hyped and fundamentally unfounded. This week, we’ll discuss a unique method of analysis of the Commitments of Traders reports for identifying speculatively driven markets.
The summer’s rally was based on expected South American supply tightness. We began sounding the alarm bells here at TraderPlanet on June 6th in, “7 Key Points on the Soybean Chart Now.” The gist of which suggested that soybean producers and soybean speculators had clearly divergent thoughts on future prices. Speculators and commercial traders had accumulated their largest opposing positions in more than four years. Eventually, the speculative net position tested its record high set in 2012. This led to the speculative trader category carrying more than five long contracts for every one contract they were short. Incidentally, this pales in comparison to the same ratios currently in the precious metal markets.
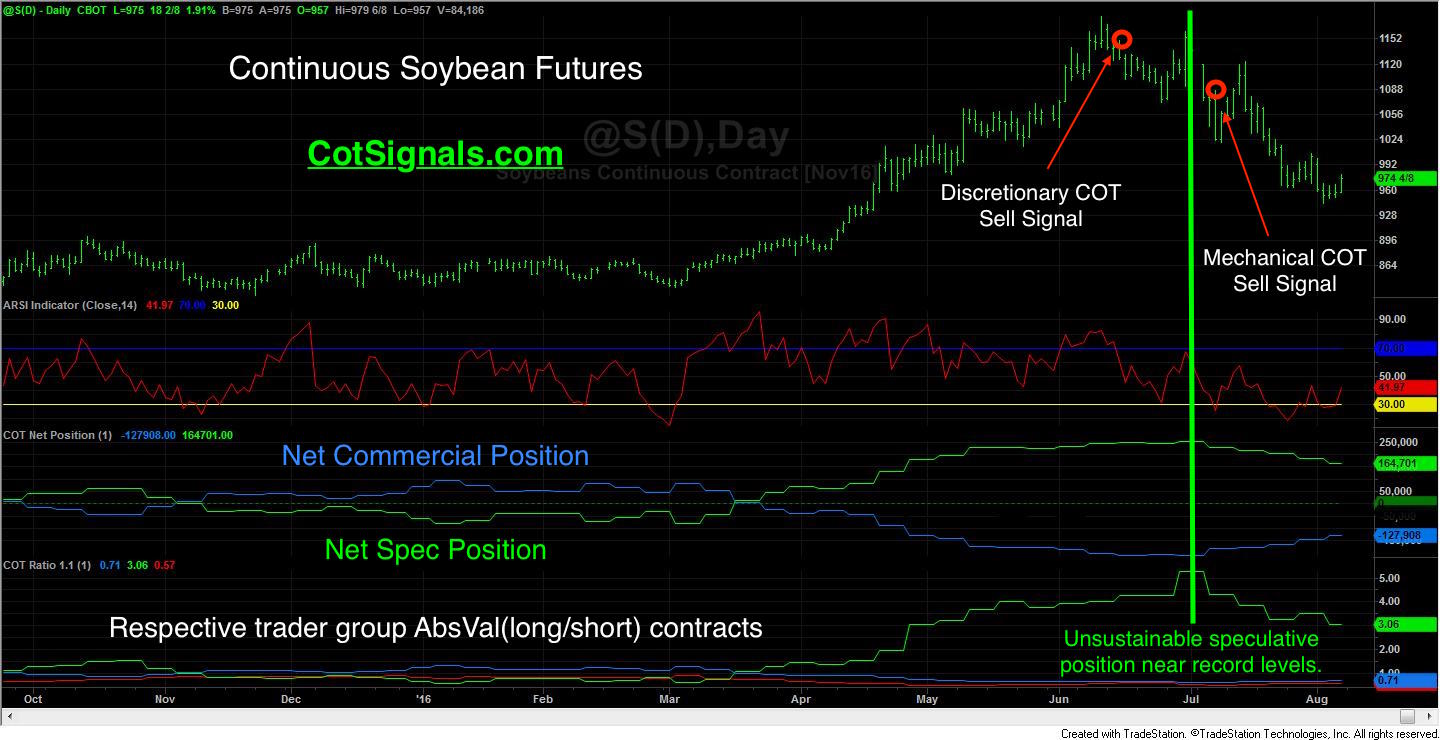
Now, if you look at the chart below, you’ll notice that it’s slightly different from our usual presentations. Normally, we would include the MACD of the net commercial trader position and use this as our initial screen for determining market sentiment. I’ve used this successfully for several years but, I’ve recently had an, “A-Ha!” moment that solved the data issues preventing me from calculating the Commitments of Traders data in a way I’ve long felt would be more beneficial to determining turning points and thus, enhance my swing trading windows of opportunity. The two primary strikes against using MACD as a primary screen for market sentiment are the lag effect and the lag effect. Without being cheeky, it’s the issue of old data and the time it takes the MACD to adjust to current situations. The ratio method of calculation you see below is not filtered and creates a new, roughly real-time data point each week. Furthermore, through some manipulation, it indicates sentiment as a quantifiable value that we can use in a mechanical trading program.
We’ll elaborate more on this process over time. Now, let’s move to the trade and the current situation. You can see that that using the ratio indicator combined with a short-term market momentum trigger, ours is a proprietary version of RSI, created the discretionary sell signal we sent to clients on June 15th and the mechanical sell signal we sent out on July 7th. Now, over the last few weeks, two things have happened. First, long speculators have gotten washed out as the market has declined by more than $1.50 since we put out the sell signals. This has caused the total speculative position to decline by more than a third and has brought the speculative long/short ratio down to a still elevated level of more than three longs for every short. Secondly, the decline has brought commercial processors back to the buy side. These two factors are combining to set a short-term bottom as beans try to find support. We’d initially called for a short target around $9.25. However, based on Friday’s technical action, we think the $9.43 low in the September contract may hold, for a bit. This has led to Discretionary COT buy signal. We will place the protective sell stop at the $9.43 low and see what kind of bounce we get from here.
For more information on our service or, to have our trading signals delivered nightly to your email box, please visit CotSignals.com.