The S&P 500 is trading in new all-time high territory but the price action has been much more rotational than directional to the upside. So what does that mean for the index in the near-term?
Click here to watch a video explaining how to read markets using volume at price.
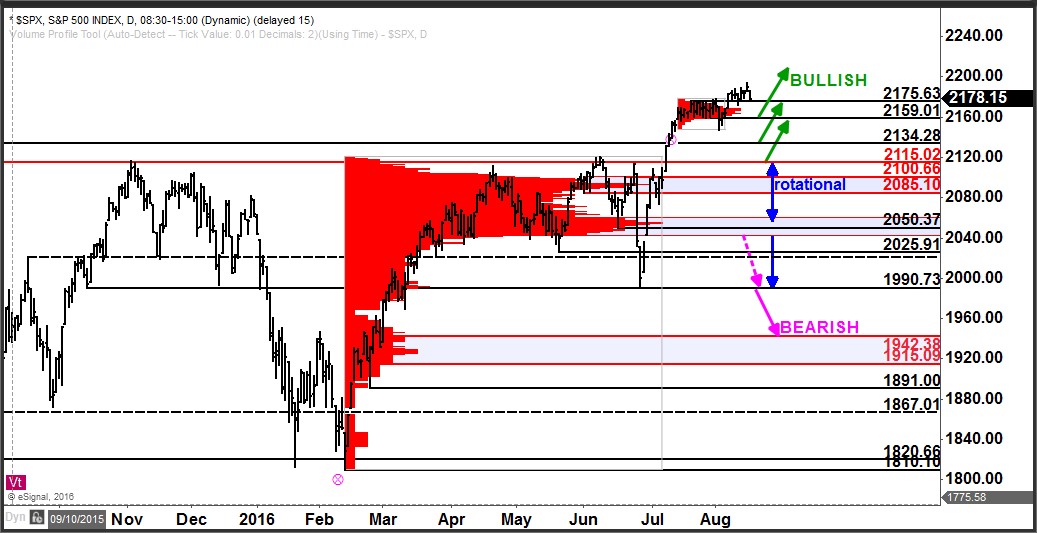
As you can see in the chart below, shortly after the break to new all-time highs (above 2134) the index entered into a consolidation between 2159 – 2175. This is now a near-term zone of support with the highest volume accumulation beginning at the 2169 level.
While the index maintains above this zone, the bias remains firmly bullish. Only on a breach of this zone would the SPX be sending a signal that a near-term pullback correction was underway.
As we approach the next Fed meeting minutes release, we can use the 2159 – 2175 as nearby inflection point. If the index does decline below this zone, the larger bias is still bullish with lower supports at a retest of the breakout level at 2134 as well as at 2115.