

The MTB Pro Trade Plans have exclusice Trading Decision Points each day for Forex and Futures Instruments. This is the second in a series of educational articles where we define high probability Entry Strategies to use when trading our Trade Plans each day. This particular entry strategy combines Bollinger Band Breakouts with a Directional Movement Index trading strategy and is explained in detail below. You can also check out our first article in this series which teaches our Moving Average Crossover Entry Strategy – HERE
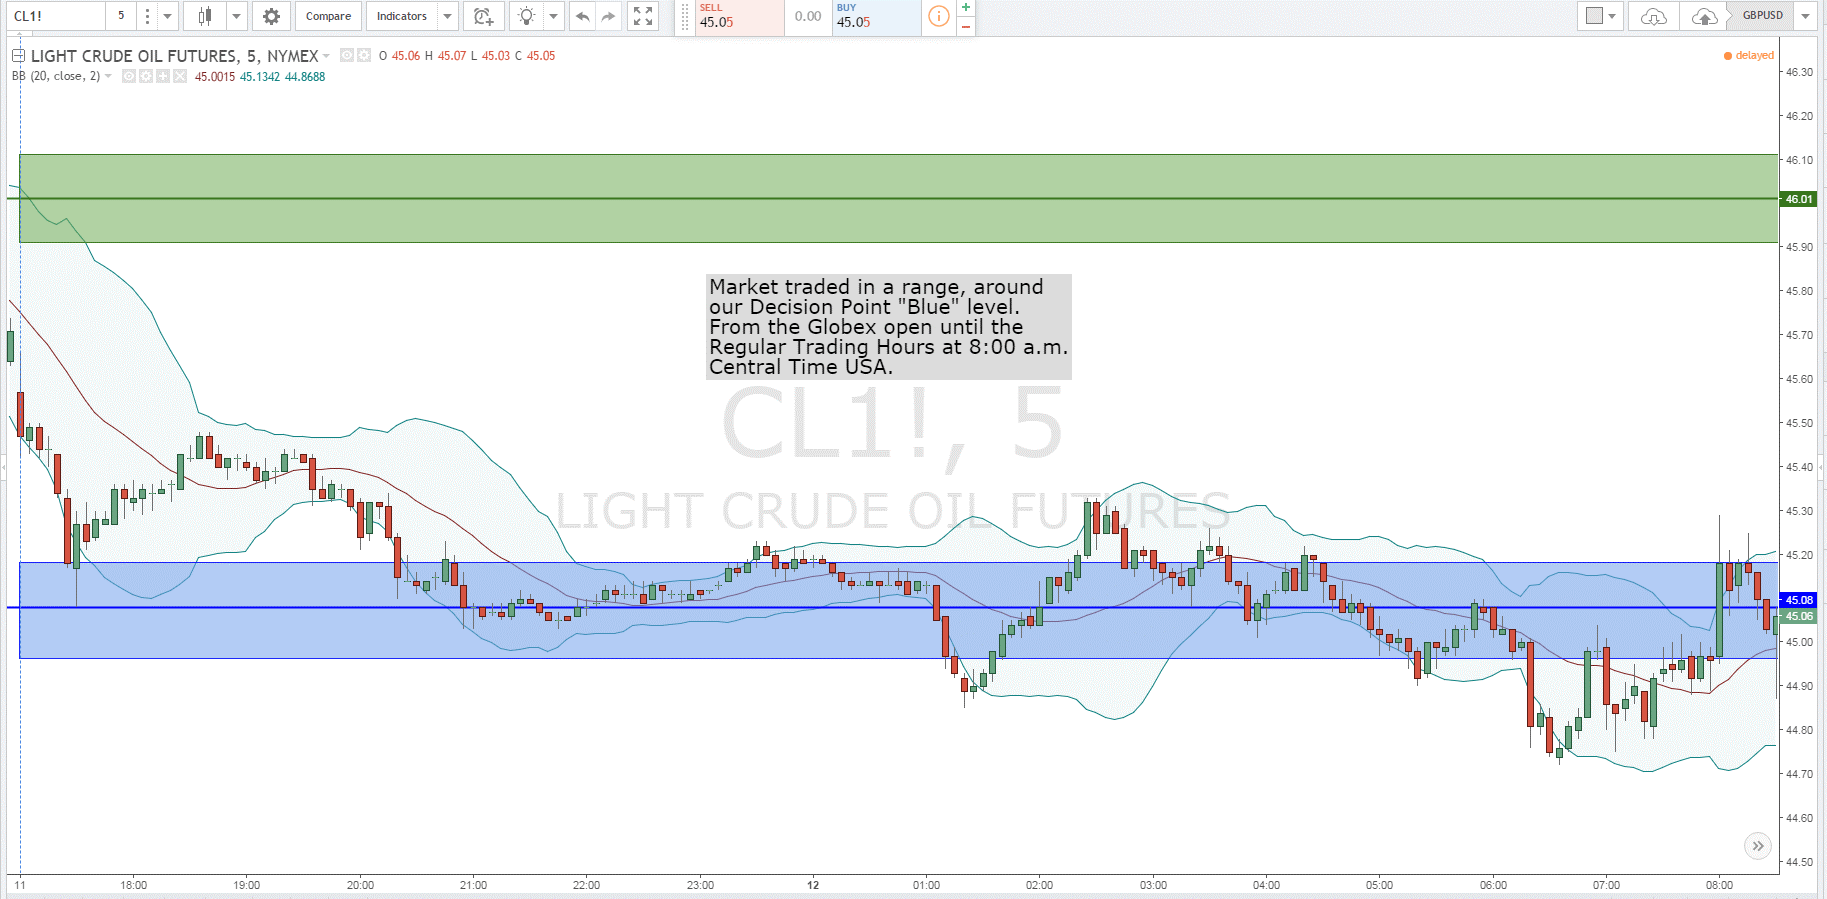
Chart 1: This chart (5-Minute) shows how the market was range bound around our decision point.
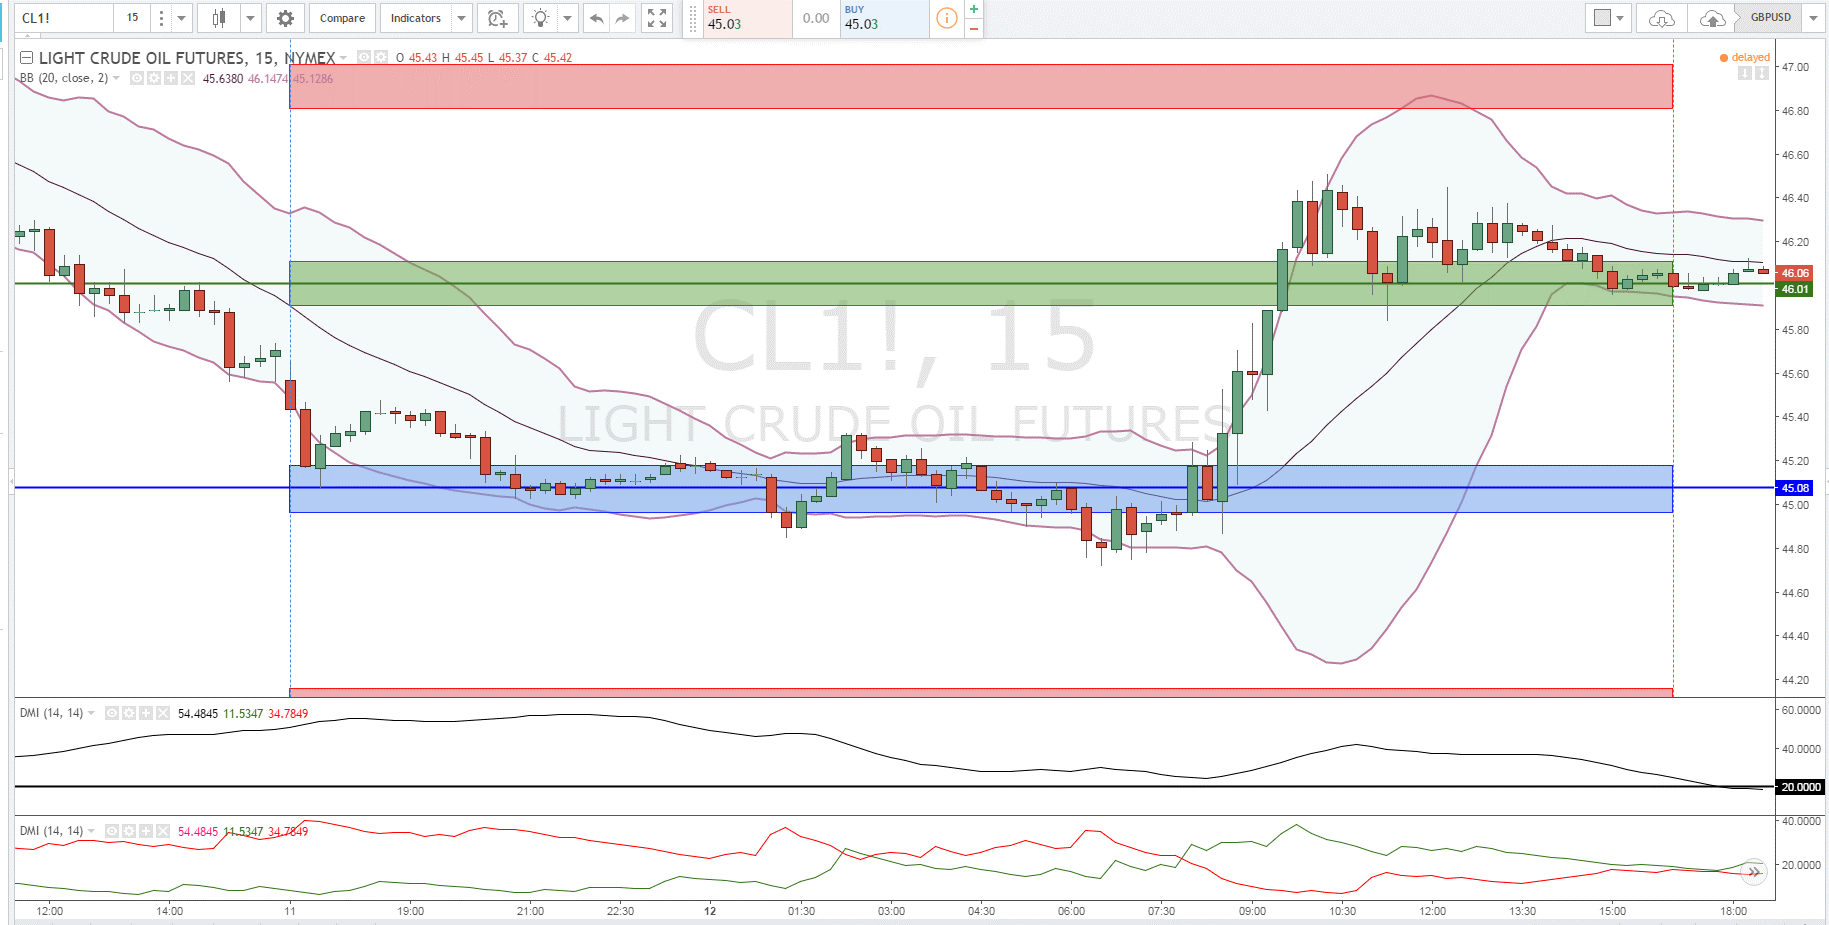
Chart 2: In this 15-Minute I have added a simple Directional Movement Indicator to this chart for further clarification. Also, you can see that the market rallied from our Decision Point (Blue) to our Decision Point (Green). This is all well and good, but how could you have taken advantage of this move?
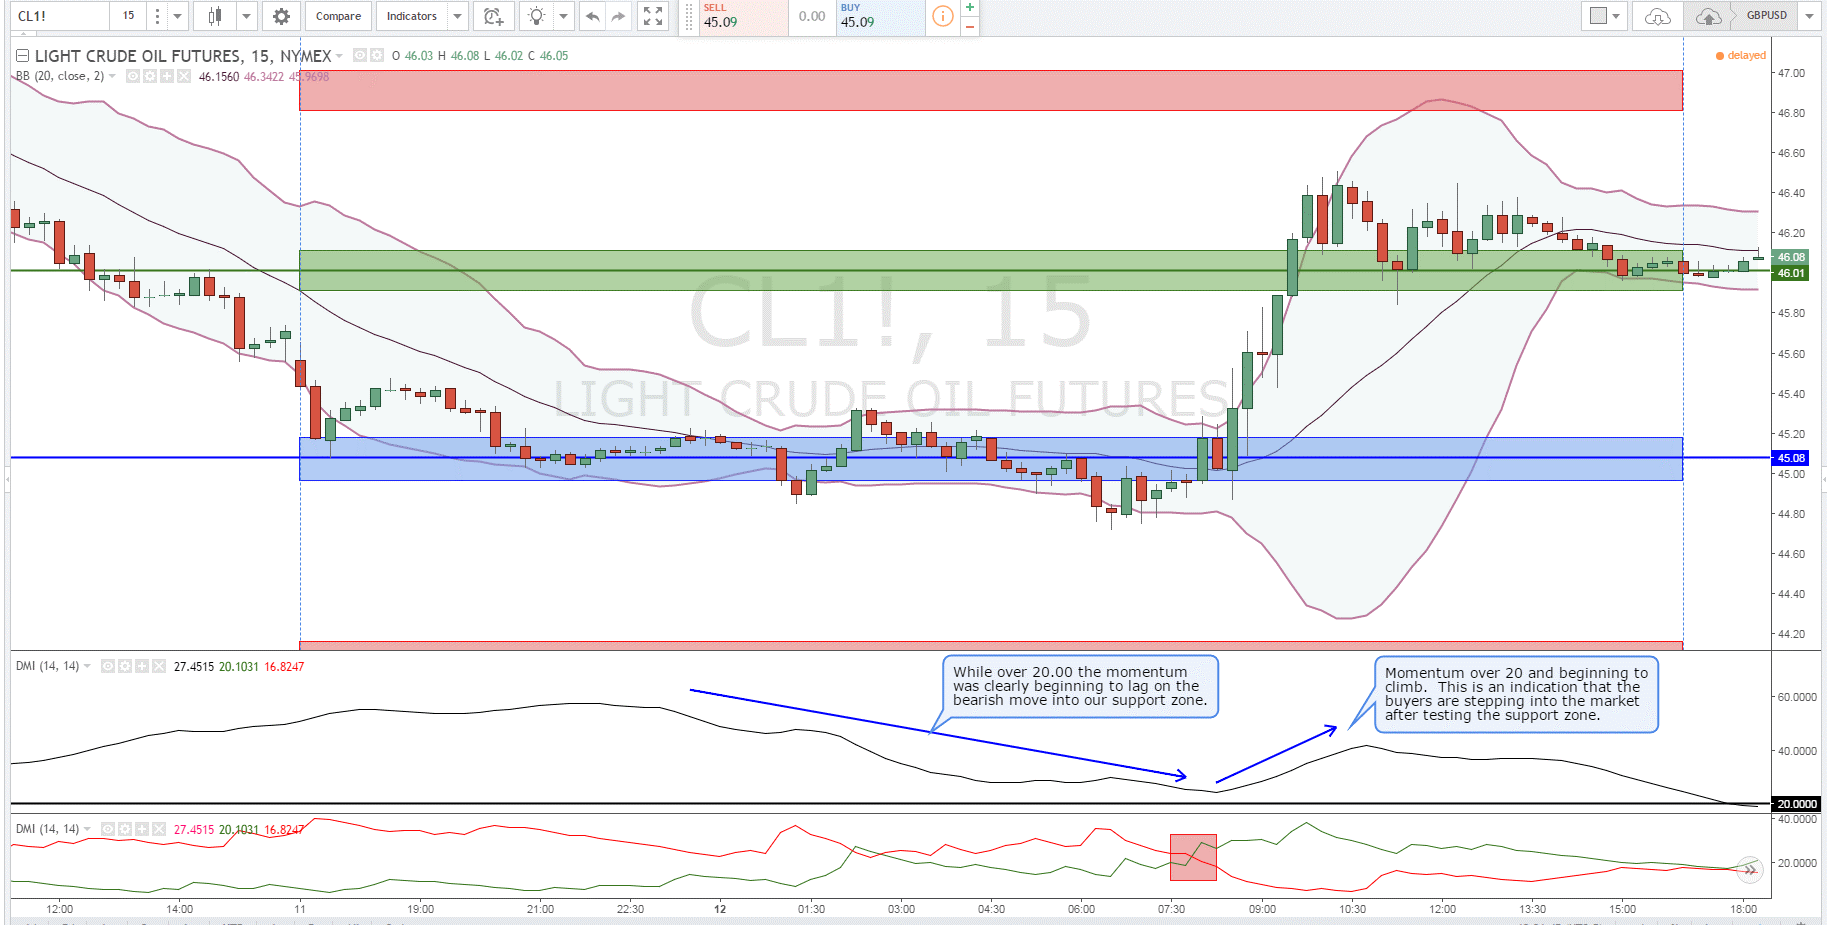
Chart 3: Before I continue on with the analysis, let me explain the value of the Directional Movement Index, indicator. There are 2 components to this indicator. For the sake of this demonstration, I have separated these indicators into 2 components. The first component (panel 3) is the +DI and the -DI. This simply indicates the direction of the trend. if the +DI (green line) is above the -DI (red line) then the trend is bullish and the reverse is true if the -DI is above the +DI. The second component to this is the ADX line (panel 2). If this line measures the strength of the trend, and it does so in two ways. The first way it measures the strength of trend is if the ADX line is above 20. Also, the direction of the line is important as well. If the above example, the first blue arrow shows the ADX is above 20, but the momentum is declining while the second blue arrow shows that the momentum is above 20 and rising. This is a good sign that the momentum is beginning to strengthen.
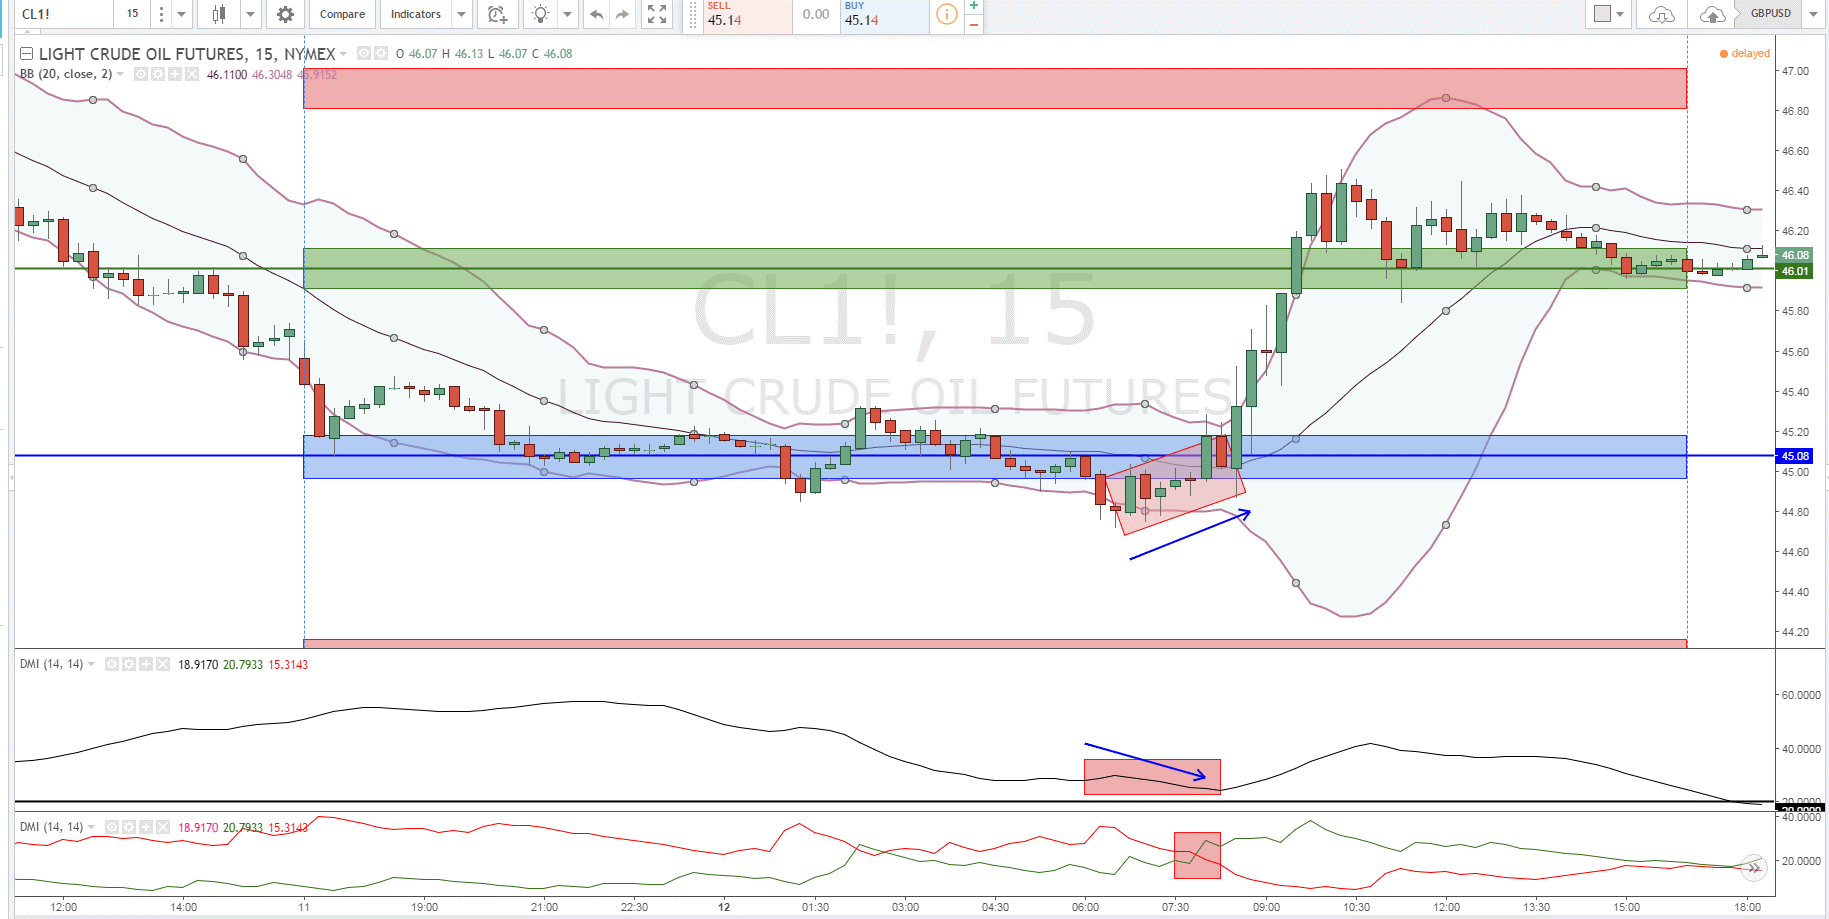
Chart 4: The final pieces to the ADX is to look for divergence. In the above example, the ADX (panel 2) was showing waning momentum while price action was beginning to move up this, is a “divergence” indicator that a shift in direction was on the way. Also notice in panel 3 that the DI had crossed above the -DI indicating that the action was shifting to a bullish bias.
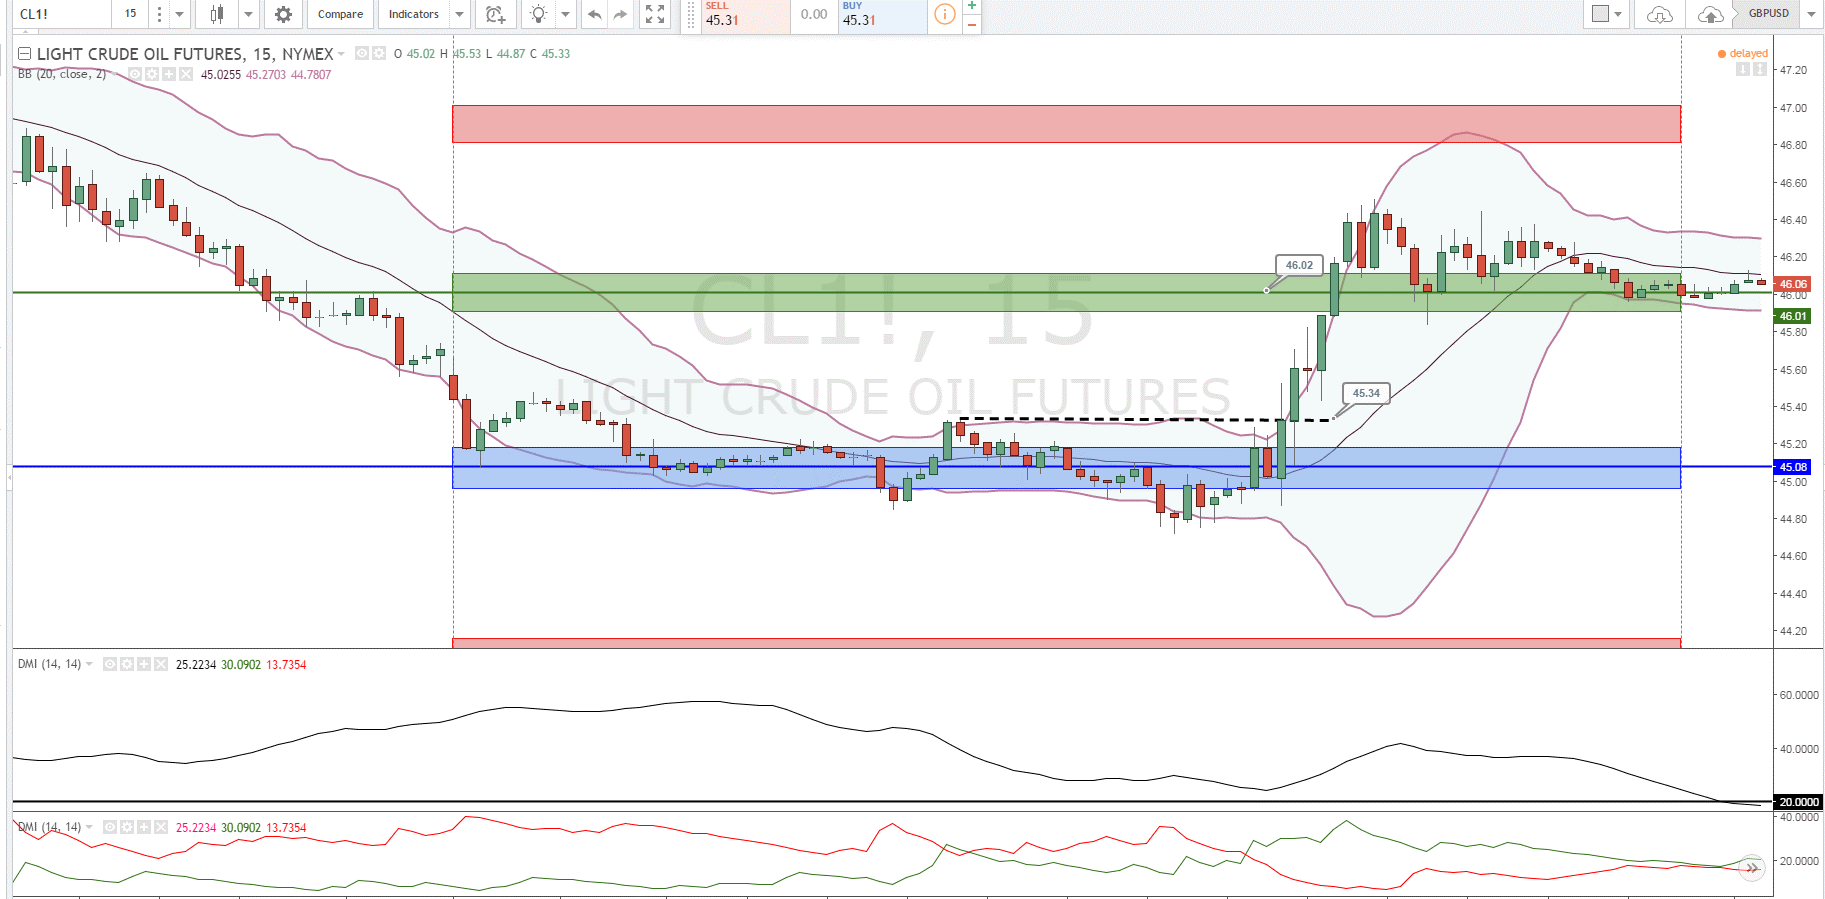
So in this final chart, you can begin to put the pieces together for a trade setup.
- +DI crossed above the -DI for an indication that trend was shifting positive after the test into the area.
- The divergence in momentum and price action (chart 4) on the ADX gives you an indication that price was turning.
- Signal bar broke and closed above the EMA on the Bollinger Bands.
- Price broke above last swing high at 45.34.
- Price then carried on to the next price level (as expected) for a minimum move of 68 ticks or $680 per CL contract. Also, remember that since we were expecting choppy trading conditions, our target would have been the next price band as we were not expecting aggressive follow through on the day.

