Those of you who read our column regularly know that our specialty is the analysis of the weekly Commitments of Traders (COT) reports. This week, we’ll look at a new calculation method we’ve been developing and have now employed in our own trading. I think we can get you pretty close to the idea without divulging the how exactly how we use the math behind the calculations. We’ll also combine this research with standard technical and macro analysis to determine just what’s going on in the U.S. Dollar Index futures.
First, let’s address how we deploy our COT methodology. There are three keys to successful trading. First, always know the risk on the trade. Second, choose the right tool for the job. Finally, know how to use the tool(s) you’ve chosen. We aren’t being cheeky, here. Our point is that the same data and tools can be combined in multiple manners and it’s terribly important they’re all on the same page. The weekly COT data is used by some for trend trading. It provides a big picture look at what the markets’ major participants are doing and it can be effectively employed in this manner. We are not trend traders. We are swing traders. Therefore, our analysis of the COT report lies in attempting to define unsustainable situations that will cause the market to revert towards its mean.
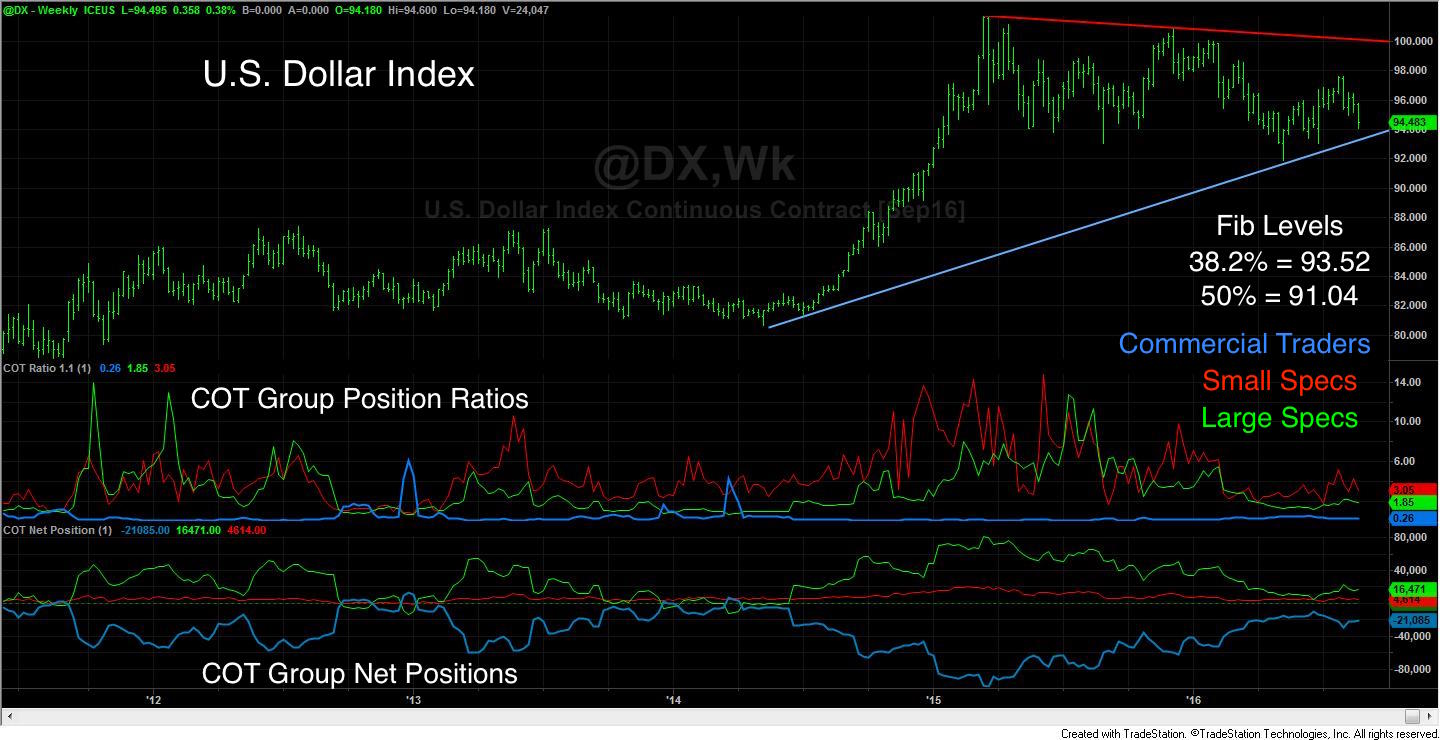
The COT report contains a couple of key pieces of information that we’ll focus on for the included chart. First is the, “Net Position.” These are plotted in the bottom pane and contain the long positions minus the short positions for each trading group. If there are more short positions than long positions within a given trading group, the net position becomes negative (net short). This information provides a sentiment proxy for the individual group’s collective outlook on future prices. As you’ll notice on the chart, commercial traders have used this long period of consolidation since the March of 2015 highs to selectively cover their short positions and bring their net position closer to neutral. Conversely, the large speculators who made money on the rally are slowly offsetting these positions as well.
Because of space restraints on the chart we haven’t included the COT Total Position. This calculation sums the total number (absolute value) of the long and short positions within each trader category and determines the total amount of interest in a given commodity at a given price level. The math involves combining this information into a single COT ratio indicator that not only tells us sentiment but also, proportional sentiment as it factors in volume, price and contract size information to determine how solid the basis is for any recent move above or, below the recently traded value area.
The more precarious the trader categories’ imbalance, the more likely the market is to return to its recently traded prices thus, making it a prime swing trading candidate. The idea is to put the imbalance on our side so that the failed rally or decline forces the imbalance to correct itself as the market returns to its mean at which time, we’ll take profits.
Thus, the big picture in the U.S. Dollar Index shows that there’s been little technical damage to the market on the included weekly chart. You’ll also notice that the small speculators are the most unpredictable followed by the large speculators and finally, the commercial traders. We see this shake out in positions to be stabilizing for the Dollar. Furthermore, when our same analysis is run across the other markets and we get sell signals in U.S. interest rates and the Japanese Yen, it confirms the macro environment is shifting its bias towards renewed strength in the Dollar Index.
We’ve got major changes in store for COT Signals. Check it out now, you’ll hardly recognize it in a month.