In a dull, dull week there was one faint sign of hope in the markets last week: the Illinois Teachers’ Retirement System, the largest pension fund in the state, decided to drop the theoretical rate-of-return on its investments from 7.5 to seven per cent. Predictably, it drove the politicians mad with rage.
This is one of those tiny pebbles that can start a landslide. The TRS has pension obligations stretching over decades, and needs to be able to estimate how much it will earn on the money it invests to pay those pensions. So they assume a given rate of return.
Until 2014 they assumed their investments would return 8% a year over a period of decades. (They actually claim an average annual return of 9.1% over 30 years). Now they are estimating they will earn 7% on their money.
This is just acknowledging reality. In a zero-interest-rate environment nobody expects consistent returns of 8%. Last year the TRS earned about 4% on its investments.
But when the estimated investment gains go down, the contribution from the government has to go up. According to the government’s calculations, that 0.5% decrease in the rate of return would have cost the taxpayers $421 million last year.
And it is an immediate cost; the obligation is due immediately, while the benefit will be felt in 30 years.
For a politician, this is something horrible. They live and die by doing the reverse: grabbing the credit now, and kicking the can down the road for the next guy to worry about.
Illinois is no exception. Since the Teachers’ Retirement System was started in 1939, there has never been a year when it was fully funded.
What is encouraging now is that somebody somewhere has finally stopped fantasizing about returns that will never occur and — in spite of the present pain — has made some small accommodation with the real world and real-world rates of return.
May it be an idea whose time has come.
Last week: waiting for the Fed
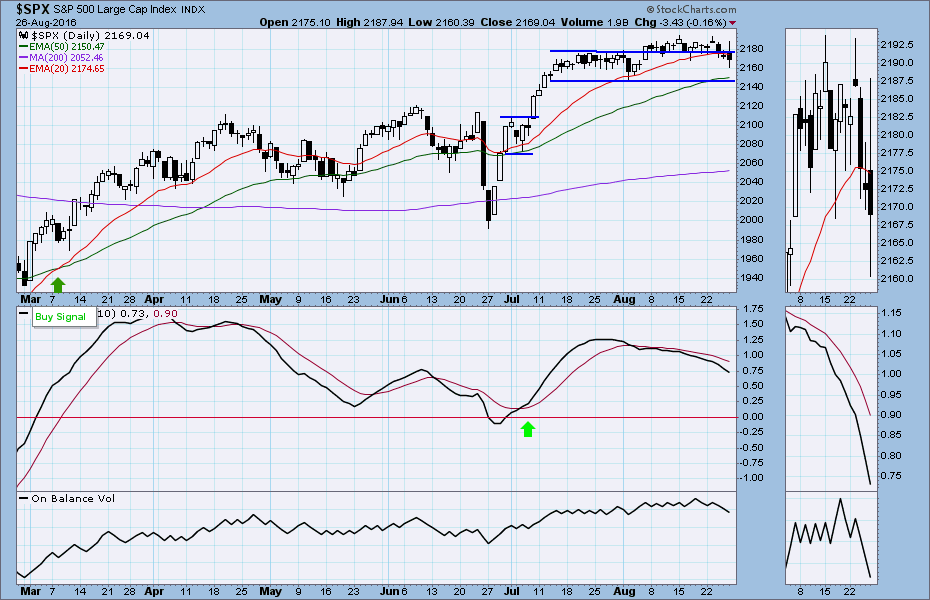
The S&P500 (SPX) the index of large-cap US equities, closed at 2169.04 last Friday, down 14.83 points for a net weekly loss of 0.67%. Ho. And hum.
So far for the month of August the average weekly range is 28.60 points, about the same as an active day when the weather is cold and traders stay indoors. The market closed Friday about seven points below where it opened the month.
These are the summer doldrums, when nobody cares much about the market, and even the momentum-igniting algo traders are away someplace, dozing through the afternoon.
Last week the proximate cause of the inactivity was a speech the Chairman of the Federal Reserve, Janet Yellen, was giving on Friday.
This was presented as the most important statement from the Fed since … well, since the last one. The punters kept their fingers away from the keyboard all week because they didn’t want to be leaning the wrong way in case she, you know, actually said something.
Misplaced caution. The Fed is following a policy of deliberate incoherence and Yellen’s statement was the usual melange of hints, pensées and allusions intended to suggest a rate increase in September without saying anything that might stick to her later.
The Fed’s September meeting is the last opportunity for a rate increase before the election, and there will be mountains of commentary discussing the possibility.
Ignore it. Raising interest rates now might tank the market, even with the Plunge Protection Team working overtime. At this stage that is not a risk they want to take.
Today
For the S&P500 mini futures (ES):
The ES sold off after European market closed Friday but managed to close above 2165.50. The price action was strong on the negative side, but the pullback wasn’t serious enough to damage the short-term uptrend. The ES remains above the major support zone 2145-35.50.
Today the 2165.50 level is a key line. Staying above it could lead ES to retest 2175 and 2180-85 zone. For the downside, a break below 2155 will be slightly bearish. A further decline toward 2145-35.50 should then be expected.
The short-term indicators still point down, so any bounce today may not last very long. Focus on the short side if there is a bounce.
Major support levels: 2155-56.50, 2146-43.50, 2133-28.50, 2103.50-00.75
Major resistance levels: 2188-89, 2196-93, 2103.50-06.50, 2214.50-12
Visit www.naturus.com for more weekly analysis of gold, oil and the S&P. It’s free.
Chart: S&P500 cash index, Aug. 26, 2016. Daily chart.