We’ve been discussing a new way of measuring market imbalance via the weekly Commitments of Traders reports. This week, we’ll compare our old method to the new method and see what it has to say about the silver futures’ recent decline.
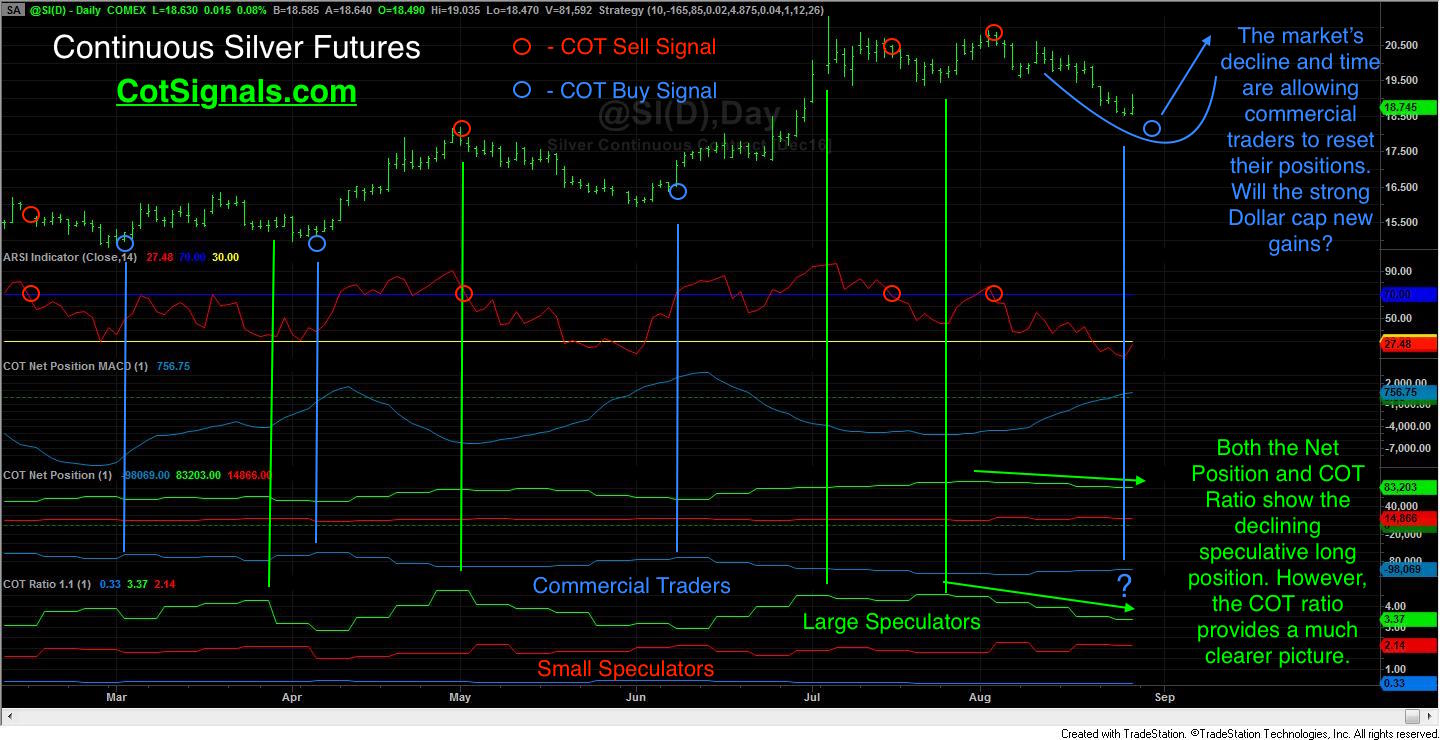
There are several pieces of information on the included chart, which should make more sense once we walk you through it. The first two subgraphs display our tried and true Commitments of Traders discretionary methodology. This simple method has been robust across time and markets and consists of two simple indicators; a market momentum trigger and the MACD of the commercial trader position. The MACD of the commercial traders’ position is calculated from the net position data in subgraph three. Very simply, we only trade in the direction of the commercial traders’ momentum. We want to be on their side. We use the market momentum trigger to signal conflict between the commercial traders’ momentum and recent market action. Currently, our market momentum trigger is oversold and the commercial traders’ MACD has just crossed into positive territory. This is the classic setup for a Discretionary COT Buy Signal.
Now, moving to our new calculation method, please look at the vertical blue and green lines. They correspond to the peaks and troughs created by the ratios of long/short contracts within the individual trader categories. These ratios are calculated each week as a single data point. This has provided two significant upgrades. First, it helps minimize lag. Any calculated average such as MACD is proportionally anchored to past data equal to the length of the average being used. Our calculation, while still a weekly data point, is not bound by recent market behavior. Secondly, this provides us with more short-term swing trading windows of opportunity. In fact, historical, mechanical back-testing has shown more than twice as many trades, primarily due to the shorter holding periods and the avoidance of long periods when the short-term momentum trigger never reaches specified trigger levels or the MACD remains stubbornly stuck on one side of the market.
Moving to the current situation in the silver market, we can see that the large speculator position peaks around 4.5 long contracts for every short contract. Just as important as the ratio of long/short contracts is the outright size of their total position. This is what gives weight to the proportion and in this case, the recent highs were set on a record large speculator position. This is how we isolated the massive speculation in the silver futures. This is also what put us on the defensive after silver traded more than $21 per ounce in early July. See, “What does the Big Speculative Position in Silver Mean?” for more background.
We said the market would need to decline or consolidate to allow the traders’ position imbalances to equalize when we wrote the last piece at the beginning of August. The last three weeks have seen nearly a 10% decline in silver prices along with an appropriate trimming of positions on both sides of the market. We see this as generally constructive for the silver market as it needs to regain its balance before extending its move higher. We don’t necessarily think the sell-off is over but, we do think it may be time to look for bullish patterns as they develop. As you’ve seen based on the vertical green and blue signals generated by our COT ratios, the ebb and flow of action between these two groups can provide timely keys to future market movement.
Please visit CotSignals for more information.