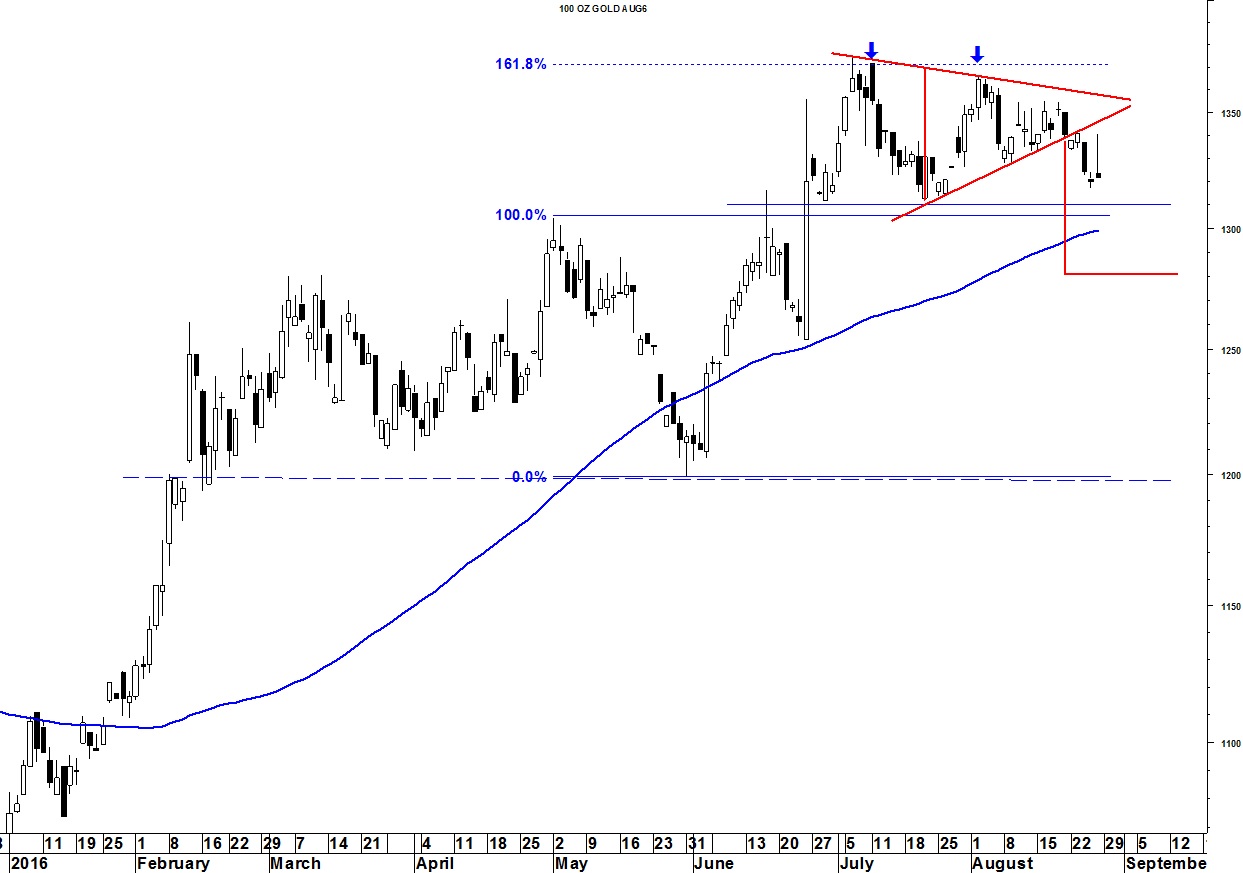
Gold lost $18.90/oz. last week and closed on Friday at $1,321.50 (-$27.50 for the month). Resistance is at 1,365 (38.2% retracement of the 2011 bear market) and support is near 1,310. A break of 1,310 would lock in the double top pattern marked in the chart below. Gold triggered the triangle on the daily chart. It measures a minimum decline to 1,280. Seasonality is bullish in September.
Longer term, the weekly Coppock failed to confirm the recent high supporting expectations of an important top. An impulsive five waves down from 2011 tells us the decline was wave A which is followed by an upward correcting wave B and, finally, a decline to (at least) last year’s lows with wave C.
Try a “sneak peek” at Seattle Technical Advisors.com