

Annual growing and economic cycles cause repetitive commodity price changes during particular times of the year. The tendency of the market to repeat these price changes is known to commodity traders as seasonal analysis; I believe such analysis can benefit traders wishing to improve the probability of their commodity trading results.
Seasonal tendencies are not perfect; in some years the move comes early, in other years it comes late, and on occasion, the anticipated seasonal pattern doesn’t occur at all. Even worse, on years in which the annual norm doesn’t materialize the market often undergoes a massive counter-seasonal move capable of catching complacent seasonal traders off-guard in devastating proportions. Nevertheless, if a particular commodity behaves in a certain manner more often than it doesn’t, traders should be paying attention. After all, trading is a zero-sum game (ignoring transaction costs) so if you aren’t putting the odds in your favor, you are actually stacking them in favor of your opponents.
Here are a few seasonal patterns that should be considered as we approach year’s end:
Corn and Soybean seasonal Charts
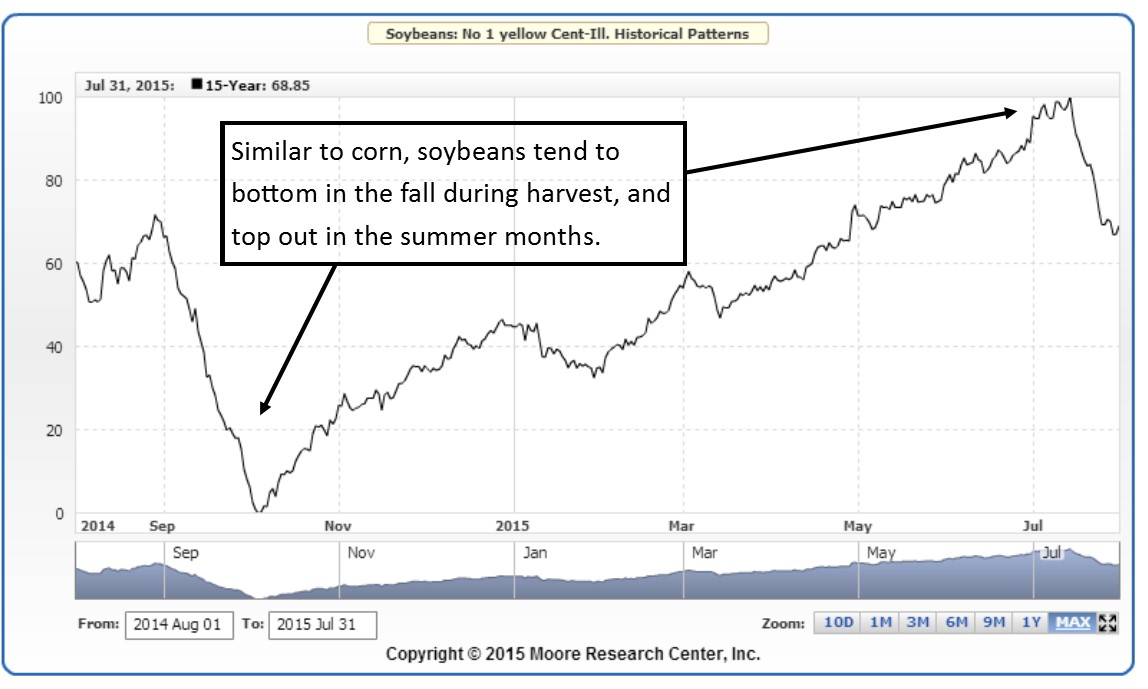
During years in which there are significant weather threats, such as drought or persistent and torrential rain, there are sometimes sharp mid-summer grain rallies with enough force to create an annual high. That is more of an exception than a rule. With the exclusion of temporary weather spike rallies typically occurring in mid- to late June, in most years, the summer months see corn and soybean prices erode along with time (Figures 21 and 22). This is because the more time that passes, the less probable it will be for an unforeseen event to interfere with the growing seasons.
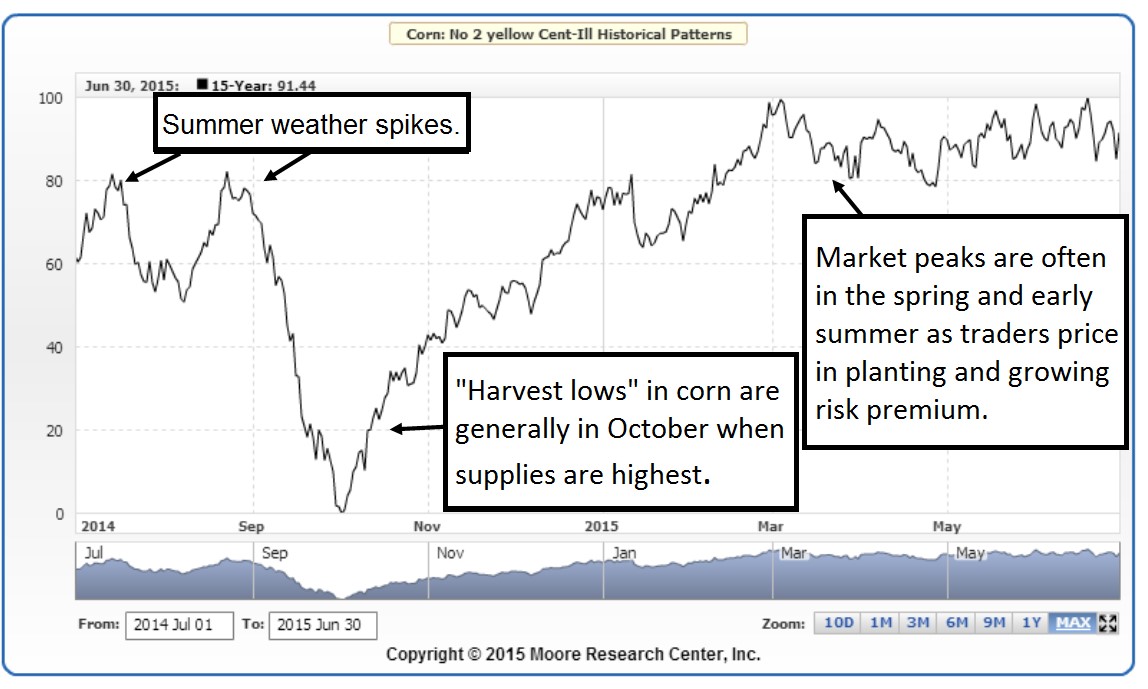
You may have heard the mantra, “Rain makes grain.” It is said that during the grain growing months, which usually span from May through August; the trading bias is negative if it is raining in downtown Chicago. This is because the Windy City is located in the heart of the grain belt and if it is raining on Wacker Drive, it must be getting to the nearby cornfields and this promotes higher production yields. However, even too much of a good thing can eventually have the opposite effect.
Gold seasonal Chart
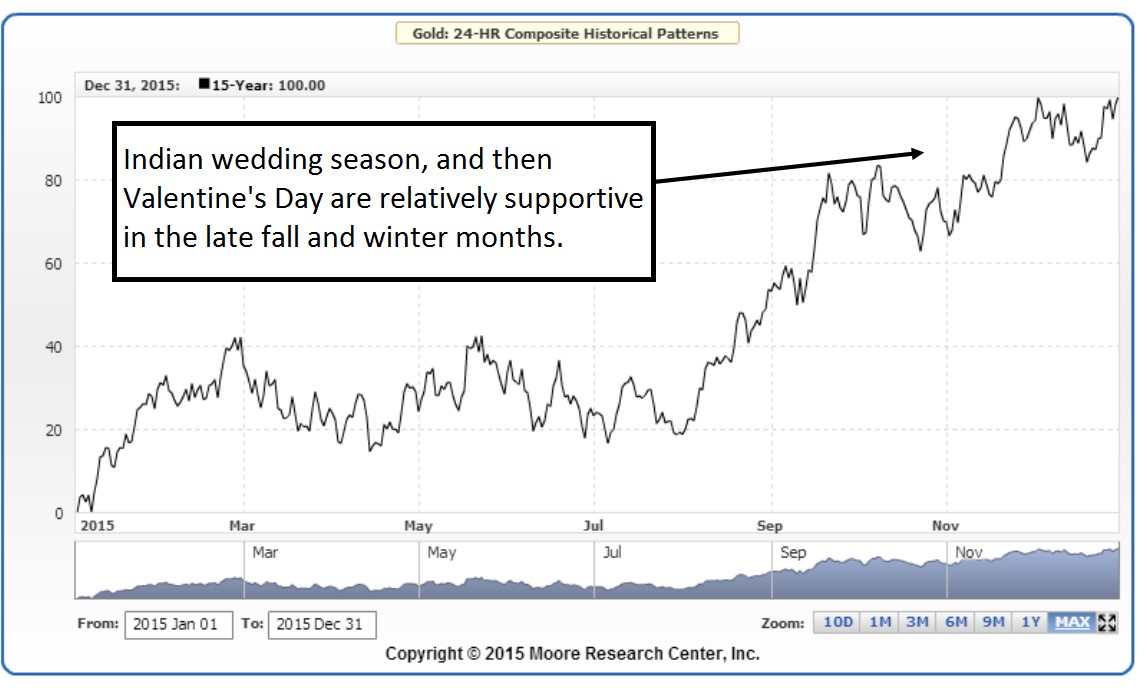
The fact that gold prices have one of the more reliable annual patterns isn’t an obvious one because it is a mined commodity. With little regard to season, or Mother Nature, the supply of gold remains relatively constant. However, the demand for gold is as seasonal as it gets. This is because gold is an asset that has little consumption value. Instead, its value is based primarily on perception. Further, the view of its value varies greatly with annual economic cycles and even holidays.
For instance, the demand for gold picks up prior to Valentine’s Day in the US, and the wedding season in India. Specifically, gold prices often rise in December and February but taper off afterward, reaching a seasonal low in mid- to late summer. Gold then finds strength through early to mid-September prior to the Indian wedding season, which spans from October through December (Figure 24).
Elaborate weddings in India date back thousands of years and have consistently been a driver in the gold market. Traditional Indian weddings involve a bride draped in gold, helping India to become the largest consumer of gold jewelry in the world; members of the Indian population are also big fans of physical gold bars and coins. India accounts for roughly a third of global gold demand, with half of that being spent on jewelry for the average 10 million weddings held there each year.
Learn more about commodity market seasonals
It would be impossible to give this topic justice in a short article, but I dedicated a chapter in my latest book, Higher Probability Commodity Trading, to the study of commodity market seasonals. If you are interested in learning more about this topic, the book is available through all major vendors.
Carley Garner is the Senior Strategist for DeCarley Trading, a division of Zaner, where she also works as a broker. She authors widely distributed e-newsletters; for your free subscription visit www.DeCarleyTrading.com. She has written four books, the latest is titled “Higher Probability Commodity Trading” (July 2016).

