The S&P 500 ($SPX), the cash index of large US companies, had the kind of day that horrifies stock traders on Friday.
It gapped down 11 points at the opening bell, and went straight down the rest of the day — literally; every single hour of the day session closed lower — until they finally let it rest at 2127.81, more than 63 points below where it had closed the day before.
It took back all of the gains made since the second week of July. Say so long to all those new all-time highs.
What made the slaughter more frightening was the contrast with a market that had spent most of August and the first three days of last week just chugging along on auto-pilot. The large caps have been overbought, and were lagging a bit behind small caps and the NASDAQ, so a little retracement was expected.
But what happened Friday didn’t feel like a little retracement; it felt like an opening act for the Rocky Horror Picture Show, and the prop desks and the big money were all in front of the screens early this morning, waiting for the second shoe to drop.
For what it’s worth, we don’t think this is the start of The Big One, the decline that finally ends the third-longest bull market in US history.
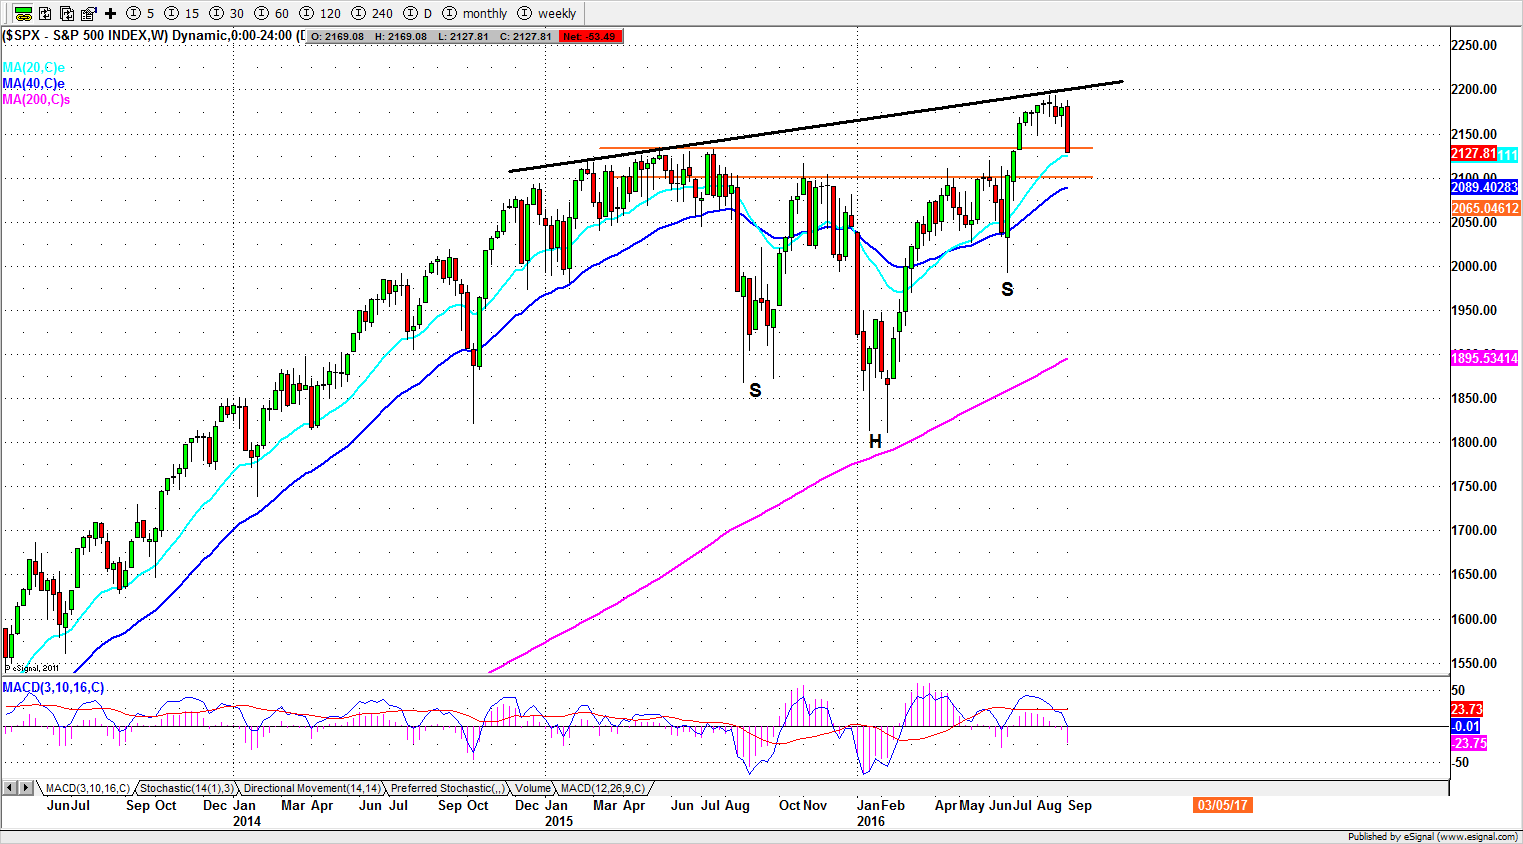
Friday’s decline took out the August low, but it stopped above the 20-week moving average (around 2125) and well above the previous break-out level above 2103.
It may even be presented as good news: how can the Fed raise interest rates when the market is so obviously fragile? Expect a lot of Comfort Talk for a while.
But don’t buy it. September and October are the two worst months of the year for stocks, and the market is vulnerable to a larger – perhaps much larger – decline. There remains much more room to go down than up.
Still, there is a nasty (and surprisingly close) election being fought and there will be a lot of effort expended to make sure nothing that could be interpreted as a crash occurs before November.
After that, all bets are off.
This week
Friday’s selling didn’t do any damage to the intermediate-term and long term uptrend. An inverse head-and-shoulders pattern suggests there is more upside to come … eventually.
But first the breakdown of the August monthly range may lead the index to continue moving lower until it completes a short-term correction.
We expect a continuation low move, although the Bulls may be able to organize a little rally of some kind. Any bounce is likely to be brief however. The short-term top is in.
This is quadruple witching week, when indices, futures and futures option all expire. The result is usually increased volatility, and choppy price movements. We also have a fairly heavy schedule of economic reports in the second half of the week.
On the upside, the former support at 2147-50 will be the resistance line to watch. The major resistance this week is 2163-73.
On the downside, 2113-2103 – the previous breakout zone – will try to stall the decline or slow down the selling. A break below 2098.50 could trigger panic selling; in that case an extended move to near the 200-day moving average line (2055-45) is possible.
Today
For the S&P500 mini-futures (ES):
Friday the ES gapped down and closed the day at 2116, down 61.50 points, a 2.8% loss. The minis continued to trade slightly lower in the early overnight trading.
The ES may have over-reacted Friday, but the break below last month’s low confirms that a short-term top has been posted. At least for this week, ES needs to find a foothold first before it can rally back.
On the upside, the range break-down point is 2141.50, and the futures may attempt to test that area, if not today then later in the week. If the Bulls are too discouraged, they may settle for 2134-35.50 instead.
On the downside, 2103-4 is an important support level. If it holds, expect a little bounce. If it fails to hold, look for a downside target around 2088-2092.
Major support levels: 2103.50-01.75, 2091.50-87.50, 2078.50-75.50, 2065-62
Major resistance levels: 2134-35.50, 2156-57, 2163.50-61.50, 2175.50-78.50
Visit www.naturus.com for more weekly analysis of gold, oil and the S&P. It’s free.
Chart: S&P500 cash index, Sept. 2, 2016. Weekly chart.