We normally focus on short-term trading ideas here for TraderPlanet. In light of the Federal Open Market Committee’s (FOMC) meeting on the 21st, and the record-setting buildup of pressure within the gold market, we felt it was the right time to step back and take a look at the bigger picture. The included charts contain several important data points. We’ll examine what has changed since the all-time highs were reached in 2011, how that same behavior is beginning to assert itself again and what the possible outcomes are later this month.
The foundation of our research is the weekly Commitments of Traders reports. This report contains the actions of the market’s biggest participants. Our thesis is two-fold. First, it states that no one knows their markets better than those whose livings are made directly from the correct valuations of the markets they’re trading. These are the traders in the commercial category. They are the long and short hedgers whose businesses are based on either the direct production or, consumption of physical gold. This thesis lies in direct contrast to the large speculator category of traders whose objective is pretty clearly stated within their title. The second part of our thesis lies in our research that shows discrepancies of opinions between the commercial traders and the large speculators typically resolve themselves in the direction predicted by the commercial traders.
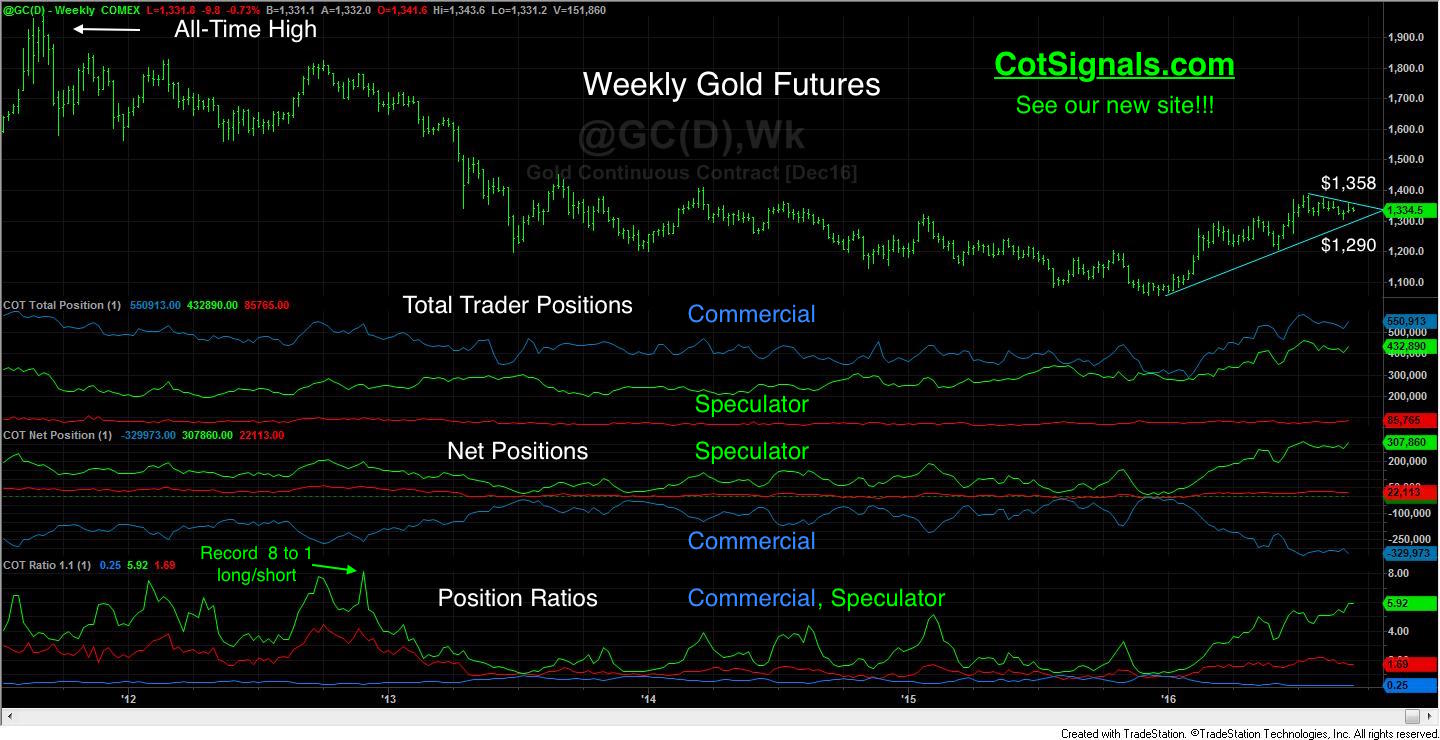
Now, let’s move to the data and explain how it all fits together. The second subgraph on the included chart plots the total position of the commercial and speculative traders. Remember that commercial traders have physical needs to be met by their business demands. As such, they’re total position remains relatively large and typically, dwarfs the large speculator position. Every market has its intrinsic differences but in the gold market, the commercial traders are the dominant force by virtue of their total capacity to deliver or, take delivery of the physical gold their hedging actions indicate. Currently, commercial traders are very near their total position record just set in July. Just as notable is the speculator position, which is also near record size though still 25% smaller than the commercial total position.
The third subplot shows the net positions of the commercial and speculative traders. This measure the current bullish or, bearish sentiment currently held by the individual trader groups. Currently, speculators are within a whisker of setting another bullish record position. The combination of total position size combined with the particular trading groups’ net position provides us with the information we need to calculate our proprietary COT Ratio, which is shown in the third subplot. We use this ratio as an indication that quantifies to things. First, it tells us when a market is being speculatively driven. Secondly, it tells us when the speculative traders may be nearing exhaustion. We then use this data to calculate potential turning points within a market.
Large speculators are currently long nearly six contracts for every contract they’re short. Furthermore, this is happening on record speculative buying. This has led to a test of the speculative all-time high ratio set in 2012 at more than 8 to 1. We see this situation as unsustainable as new speculators must be brought in to maintain the pace of buying and thus, continue the rally.
Finally, the congestion that has built up since the Brexit vote continues to narrow. Considering the size of the trading groups’ current positions and the FOMC meeting later this month, we feel gold futures are ripe for a volatility explosion. Typically, we’ll get one more push as a climactic event. This could easily be triggered by any major announcement or, news event. Based on the current technical pattern, we could see a spike above $1,410. HOWEVER, we believe this would be a short-selling opportunity of the first order. We also believe that all trades in the gold market should be viewed from the short side as there is a preponderance of evidence based on those who mine gold as well as those who process gold that the market is overvalued at these prices.
Please, come see our newly updated website, CotSignals.com, for more information.