September sucks for stocks. And the next two weeks are the worst.
The S&P 500 ($SPX), the cash index of large US companies, closed at 2139.16 last Friday, up 11.35 points for 0.53% net gain for the week, not bad for a what is traditionally the worst month of the year for equities. But there may be worse to come.
Historically, September simply sucks for equities. Last week was the anniversary of the 2008 collapse of Lehman brothers, which ushered in the Recession of 2008, as well as the anniversary of the highest point (depending on how it is counted) reached by the S&P before the epic Crash of 1929.
For those who think buy-and-hold is a foolproof investment strategy, remember that if you bought the S&P on September 16, 1929, you couldn’t get all of your money out until September 22, 1954 … when it was worth about 60 cents on the dollar.
But it gets worse. September is one of the four times a year the markets have a triple (or quadruple) witching event, when options and futures contracts expire almost simultaneously. The week after the September triple witching (that’s this week) has closed down in 21 of the last 26 years.
Maybe we should skip the outlook for this week.
This week
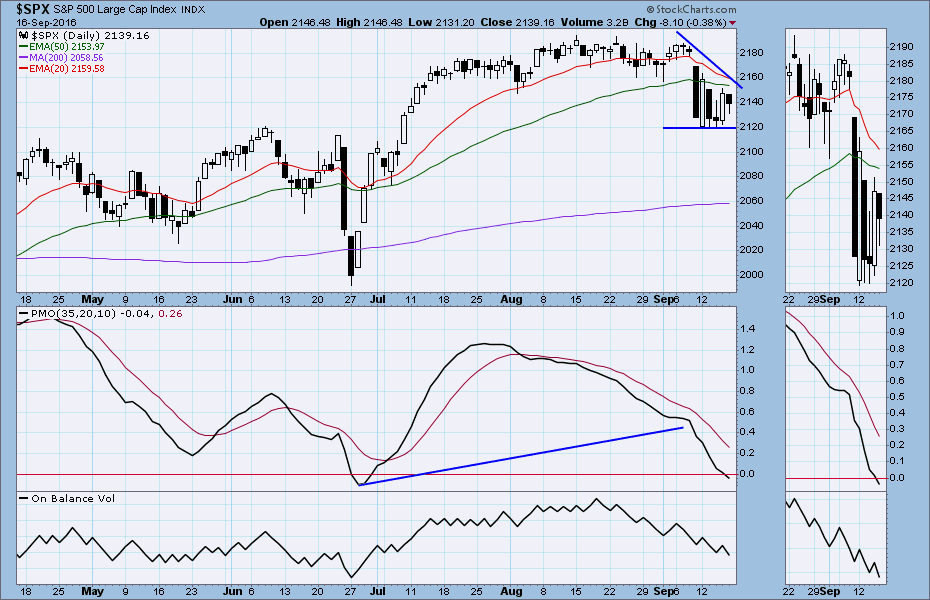
After the dramatic 50-point drop that closed the prior week, last week’s action in the SPX was primarily consolidation in a range roughly between 2160 and 2120. However the market has been making a series of lower highs and higher lows forming a wedge pattern that may lead the price lower.
The major action this week will revolve around the Fed Open Market Committee meeting on Tuesday and Wednesday, and the Chair’s remarks and press conference that follow it.
The Bank of Japan will be also be making public comments and reconsidering its position about the same time, sort of a global picnic for central bankers.
This is the US Fed’s last formal opportunity to raise interest rates before the election. The market is expecting no rate hike (as are we) but will likely be stalling until the decision is announced. Then the move may be explosive, hike or no hike.
Bombing attacks in New York City on the weekend may affect Monday’s activity.
Today
For the S&P500 e-mini futures (ES):
Last week the Consumer Price Index came in with a “Goldilocks” result: better than expected, but not so good the Fed might feel encouraged to raise the interest rate.
This week the weekly range break down is around 2141.50-45.50 and the next major resistance level is 2156-55. One or the other is likely to put a cap on any upside move.
On the downside, 2112-10 and 2103-00.50 will be current support, and Bulls will defend these levels if there is a dip.
2134-35.50 will be the pivot area. As long as ES doesn’t go above it, we will be looking first for a repeat of last Friday’s range (2135-2123). If the ES breaks the top or bottom of that range, the range can expand up to 2145.50-51 on the upside or down to 2111.75-09 (or perhaps lower) on the downside.
Major support levels: 2103.50-01.75, 2091.50-87.50, 2078.50-75.50
Major resistance levels: 2156-57, 2163.50-61.50, 2175.50-78.50
Visit www.naturus.com for more detailed analysis of gold, oil and the S&P. It’s free.
Chart: S&P500 cash index, Sept. 16, 2016. Daily chart.