This week’s article is a bit different from our usual piece. There are times when the, “Why” is harder to describe than the, “What.” Given Friday’s quadruple witching, the expiration of stock options, futures options, the underlying futures and, to a lesser degree, single stock futures, and ahead of the huge FOMC meeting announcement on the 21st, we decided to revisit a peculiar expiration pattern in the S&P 500 stock index futures. While the cause and effect may be in question, it’s hard to deny this significant correlation.
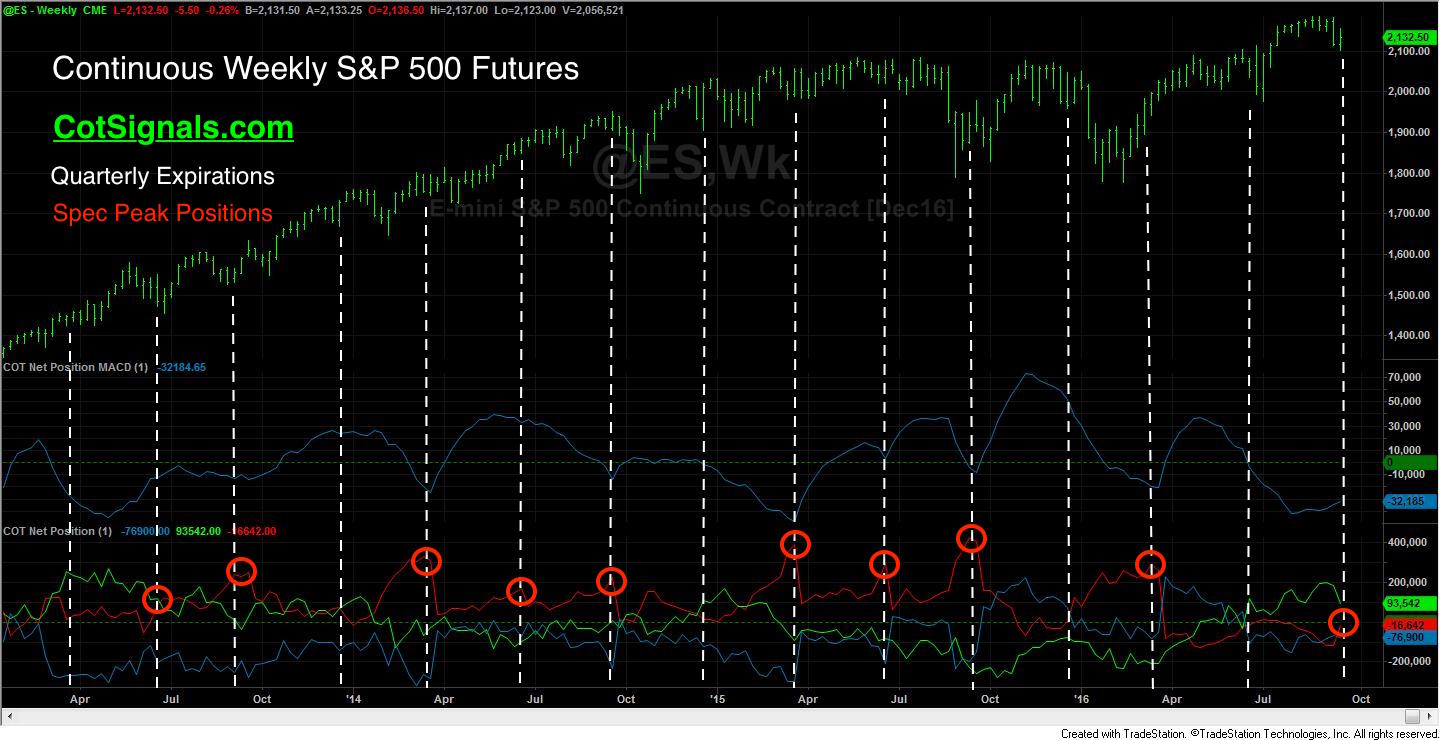
The included chart seems a bit of a mess without some explanation. We’ve plotted the weekly S&P 500 continuous futures contract in the top pane, commercial trader momentum in the second pane and finally, the net position of the three primary trader groups in the weekly Commitments of Traders report. The dashed vertical lines represent the quarterly expiration of the S&P 500 futures. The bold, red circles represent peaks in the small speculators’ position.
There’s an expiration pattern in the stock index futures that tends to play out fairly consistently and it appears that the small speculators have picked up on it. This is the intertwining of multiple traders’ strategies’ playing out in graphical form. Commercial traders tend to use S&P 500 futures and options as a hedge against or, to add leverage to their cash portfolio. Given the markets’ multi-year upward trend, it’s safe to assume that commercial traders are protecting downside volatility, rather than levering up their current equity positions. They accomplish this through shorting futures and employing various protective option positions including buying puts and selling calls. Approximately 30 days from expiration the market begins to exhibit pockets of weakness if, not a slight downward trend. Why? I don’t know, as I said, some of this is easier to see than to explain. However, if you follow the traders’ positions, you’ll see that as the market declines into expiration, the commercial traders start buying. This serves two purposes; first, it helps offset their short call option positions ahead of expiration. Second, it helps them cover short futures positions, as well. This frees up cash and helps book their quarter.
Here’s the spin, we’ve noticed over the years that the small speculators in the S&P 500 have become pretty good at forecasting near-term strength in the market, especially near the end of quarterly expiration cycles. They appear to have picked up on the commercial and are piggybacking it to goose the market into the next quarter. Obviously, we’ve been in an upward trend, but there is statistical merit to this observation. Small speculators have spiked their net long position in 10 out of the last 15 quarterly expirations. This includes three out of their four largest net long positions since 2008. Furthermore, the quarterly low was set within a week of expiration in 9 out of the last 15 expirations.
This leads us to the fuel that pushes the market higher post-expiration. Once again, there are many arguments about the, “Why.” However, the chart makes it pretty obvious that commercial momentum inflection points tend to coincide with quarterly expirations. I’d also add that commercial momentum can be seen building through the first half of each quarter more often than not.
While this is clearly an observational piece, it’s important to be aware of the patterns the market you’re trading repeats. At (many?)times, we may not know why a market does what it does, but being aware of the signs that come with it can help us prepare for whatever events are about to unfold in the coming weeks.
Please visit our newly updated site, CotSignals.com for more information on how we use the Commitments of Traders reports to forecast future market movement.