Each of these markets, crude oil, gold, and the US Dollar index, are all rotating between support and resistance levels in well-defined ranges. When they move, look for all three to make a move together. And here’s how you will know that the move is underway.
Click here to watch a video explaining how to read markets using volume at price.
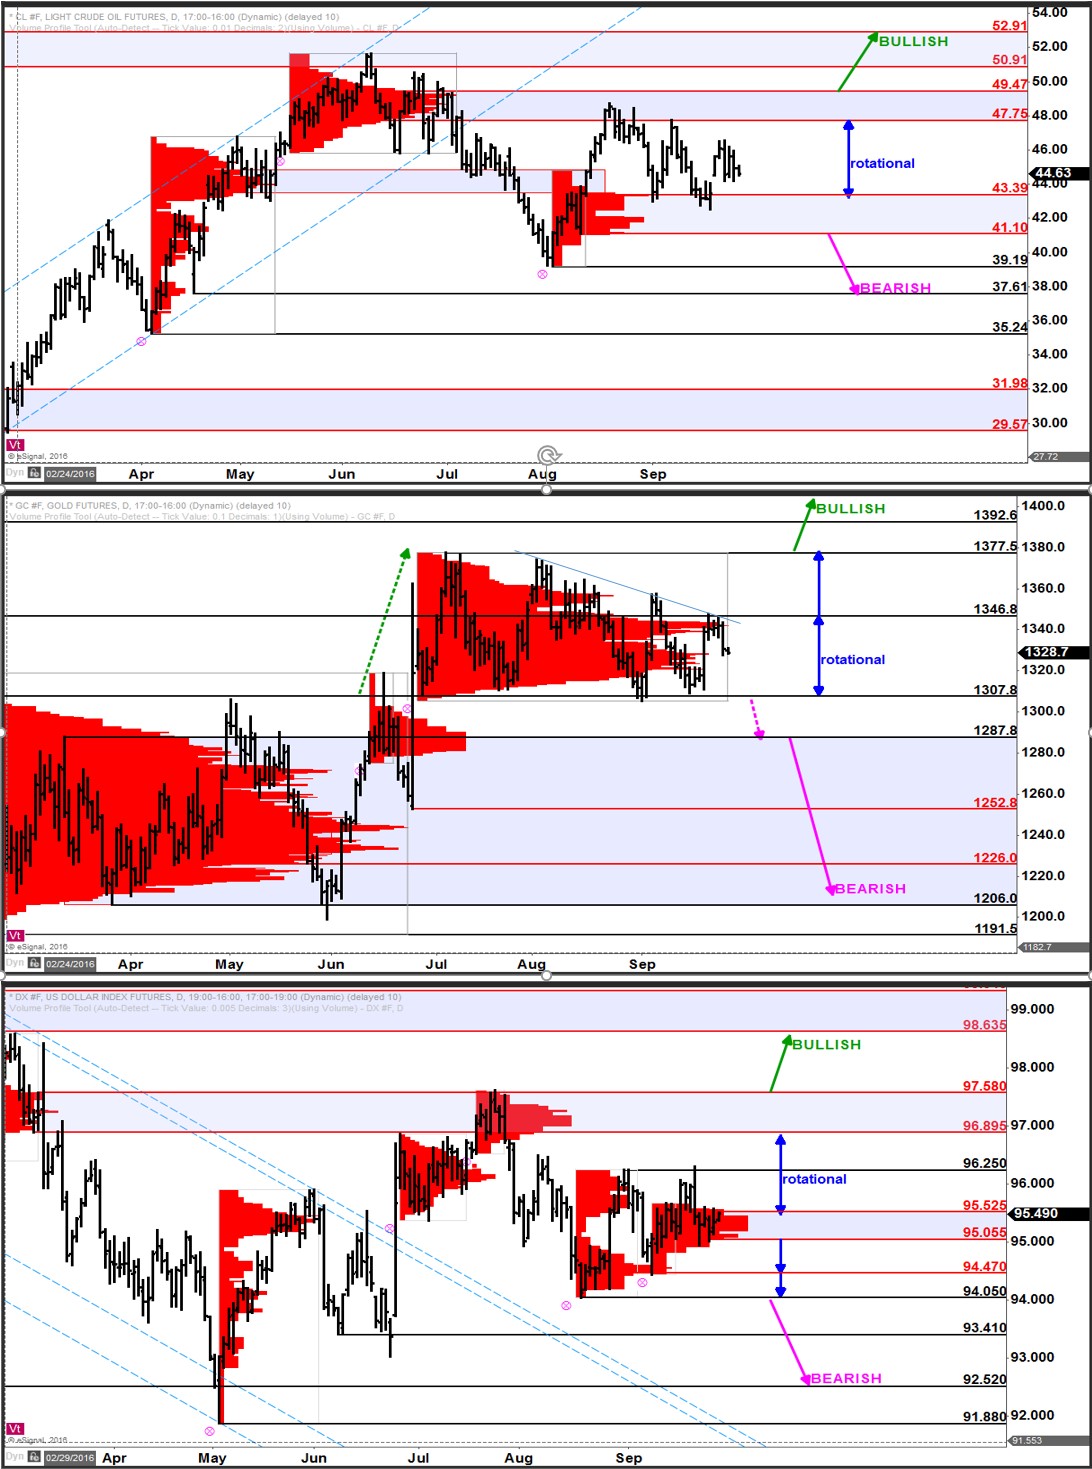
Crude oil has been oscillating back and forth between the zone of support at 41.10 – 43.39 and the zone of resistance at 47.75 – 49.47. A break beyond either of these zones will signal the next directional move in crude oil as underway.
Gold has been holding support at 1307.8 and bumping against resistance at 1346.8 with higher resistance at 1377.5. A move beyond either of these extremes will shift the larger bias to favor the bulls (on a break higher) or the bears (on a break lower).
The US Dollar index has nearby support at 95.055 and nearby resistance at 96.250. A move to extend outside of this range has additional support at 94.470 and 94.050 and additional resistance at 96.895 – 97.580.
The same market forces are driving all three of these markets. Look for crude and gold to move in the same direction with the US Dollar index moving inversely.
As each of these markets continue to march sideways, they build more and more energy for an inevitable next directional move.