The iShares Russell 2000 ETF (symbol IWM) tracks fairly closely with the Russell 2000 index, and it has spent nearly the whole of 2016 rallying out of a correction. Because the entire advance from 2009 appears impulsive, we believe IWM is working on the fifth (final) wave of an even larger fifth wave. Thus we are watching nearby resistance areas for signs of a possible downward reversal.
For the Elliott wave pattern to look complete on weekly and monthly time frames, the rally up from early 2016 should consist of five sub-waves. Currently price appears to be working on or emerging from the fourth sub-wave of that sequence.
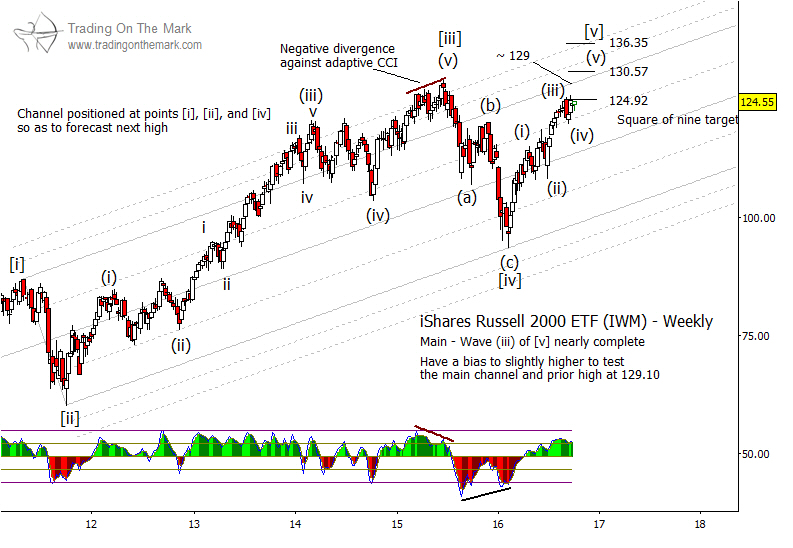
Note how the first Gann square-of-nine resistance level at 124.92 may have put a cap on sub-wave (iii) and triggered the sub-wave (iv) consolidation. A weekly close above that area should signal that price is embarking on the next and probably final leg upward.
The next square-of-nine resistance area near 130.57 is probably the best candidate to produce a reversal in IWM. However, a strong rally during the next few weeks could possibly take price to the higher level at 136.35.
Even though we are treating those resistance areas as targets, it is crucial for traders to monitor other stock indices this season as well. The Russell 2000 and IWM are performing relatively less well than the S&P 500 and the NASDAQ 100. The intermarket divergence suggests the possibility that a reversal in those other indices could pull IWM down even before it completes its pattern. This type of pattern truncation sometimes happens near major highs and lows.
For traders who want to stay ahead of the turns this autumn, we’re offering a special 20% discount on all new subscription to our daily and intraday services.
Claim your discount by using the coupon code 4FB2A when you follow the link on our subscription page.