

SHORT-TERM (today and 5 days out)
For Thursday, both 2159.75 and 2143.75 can firmly contain intraday activity, beyond which the next notable level is expected intraday. Upside today, pushing/opening above 2159.75 signal 2170.75, able to contain session strength. A settlement today above 2170.75 indicates a good weekly low, 2196.25 then expected within 1-2 days where the market can top out through next week as well as representing a meaningful upside continuation point into later October. Downside Thursday, breaking/opening below 2143.75 signals 2127.50, able to contain session weakness. Breaking 2127.50 indicates 2116.00 (2123.66 index) intraday, able to contain selling through the balance of the year and above which a secondary long-term buy signal remains in effect.
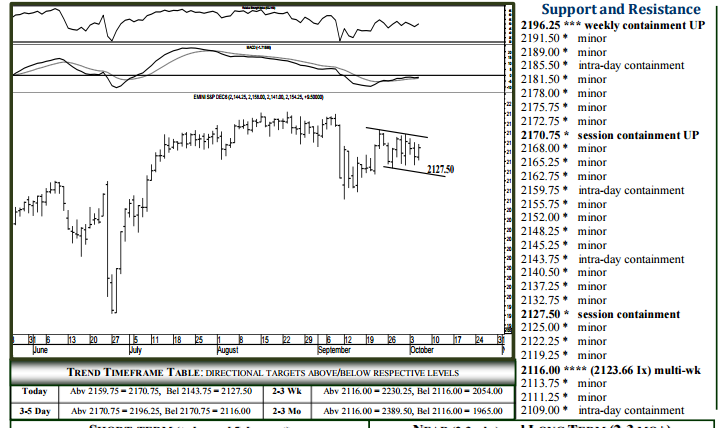
NEAR (2-3 wks) and LONG TERM (2-3 MO+)
The 2116.00 (2123.66 index – page 2) level can absorb selling through the balance of the year and above which a secondary long-term buy signal remains in effect, expecting 2230.25 within 3-5 weeks, 2389.50 within 5-8 months. On the other hand, a daily settlement below 2116.00 indicates a good 2016 high, 2054.00 then considered a 1-2 week target, 1965.00 within 3-5 weeks where the market should bottom out through November – possibly the balance of the year. Nonetheless, a settlement below 2116.00 would represent significant buy-signal-failure, allowing bearish continuation over the next 3-5 months into the 1832.25 region – this potential downside target essentially confirmed following violation of 1965.00.
To receive a two week free trial of the Daily Futures Letters and Monthly Futures Wrap, CLICK HERE

