The S&P 500 cash index (SPX), the index of large-cap US equities, closed at 2132.98 last Friday, down 20.76 points for a 0.70% net weekly loss.
That’s not a big loss. But it is worrisome to traders, for a couple of reasons.
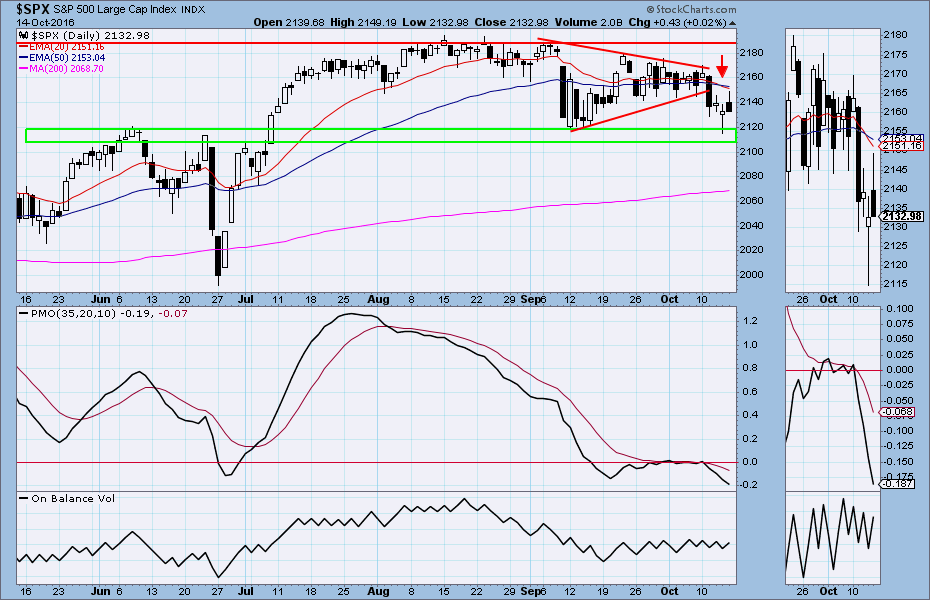
Friday’s trading was disappointing for the Bulls because of the way it ended. The market broke through an important short-term support level earlier in the week and broke below 2115 – and below both the 135-day moving average and the September low – before bouncing back 15 points into the close.
Friday was supposed to be the day the cavalry rode to the rescue, and recouped the losses. But the rally failed at the 20/40-day moving average and the market closed almost at the low of the day.
Nobody likes to see the market shut down for the weekend on the low, and especially not when we are moving into the best time of the year for stocks.
But this year feels different. The market has been making a rounded top since the all-time high in August, and while the decline since then is relatively minor (we closed Friday about 60 points below the high) we are still marking time at the bottom of a three-month rectangle range. There’s a good chance we’ll revisit the September low area 2115-20 again.
The fact we are still within the rectangle pattern means the long-term outlook is still positive, and we are still in a bullish uptrend, at least for now, especially with the end-of-the-year rally ahead.
And it is unlikely the market will go in the tank in the final stages of the most poisonous election in living memory.
The long-term outlook is still bullish; the short term looks bearish. So this week may be a little choppy. There are a bunch of equity index options expiring this week, including the monthly ES and SPX options, and that always a good excuse to push the price around.
And a large proportion of the companies in the SPX are in the blackout period connected to their quarterly earnings reports, and are prohibited from buying their own shares. Stock buy-backs have been one of the main pillars holding the market up for several months; for the next couple of weeks a lot of that support will be missing.
This week
In addition to the October monthly options expiring, we have the CPI data this week, and a couple of Fed voting members making public speeches. Both the speeches and the CPI data will affect the market, one way or the other.
Early in the week we expect a dip to retest last week’s low. As long as last week’s low or the 2100 level holds index up, a brief bounce could follow.
Absent major news affecting the market, 2175-85 will be a major resistance zone.
2106-2100 zone will be a support zone. A breach this support zone will make us rethink the current correction. The index could go lower to the next major support zone around 2065-55.
Today
For the S&P500 mini-futures (ESZ6):
Today the mini-futures (ES) are likely to move back down to retest last Thursday’s low area first. If that low holds there is a chance for it to move back to Friday’s high area again.
For the upside, 2135.50 will be a control line. A move above it could trigger buy stops and push the price up to 2143-45 zone.
For the downside, 2118.50 will be a control line. A break below it could lead ES down near 2101-06 support zone.
Daily PMO and STO indicators are near oversold territory, but continue to provide a short-term selling signal. We could see an exhaustion selling move first before ES bounces. We expect September’s low will be retested, but also expect it to hold for a while.
Major support levels: 2116-14.50, 2106.50-07.50, 2100.50-2098.50, 2089-88
Major resistance levels: 2171-72.50, 2181.50-78.50 , 2188-90.50, 2200-01.50
For more free market analysis visit www.naturus.com.