

Hey Traders from around the world. I hope you are doing grand!
So, earnings is out on IBM and even though they have what most consider their strongest earnings since 2011, IBM is gapping down.
Based on some technical aspects of this gap, I’m very interested to see how it opens.
Below is a picture of the long term moving averages on IBM. It’s below the 100 SMA (the blue line) and above the 200 SMA (the red line).
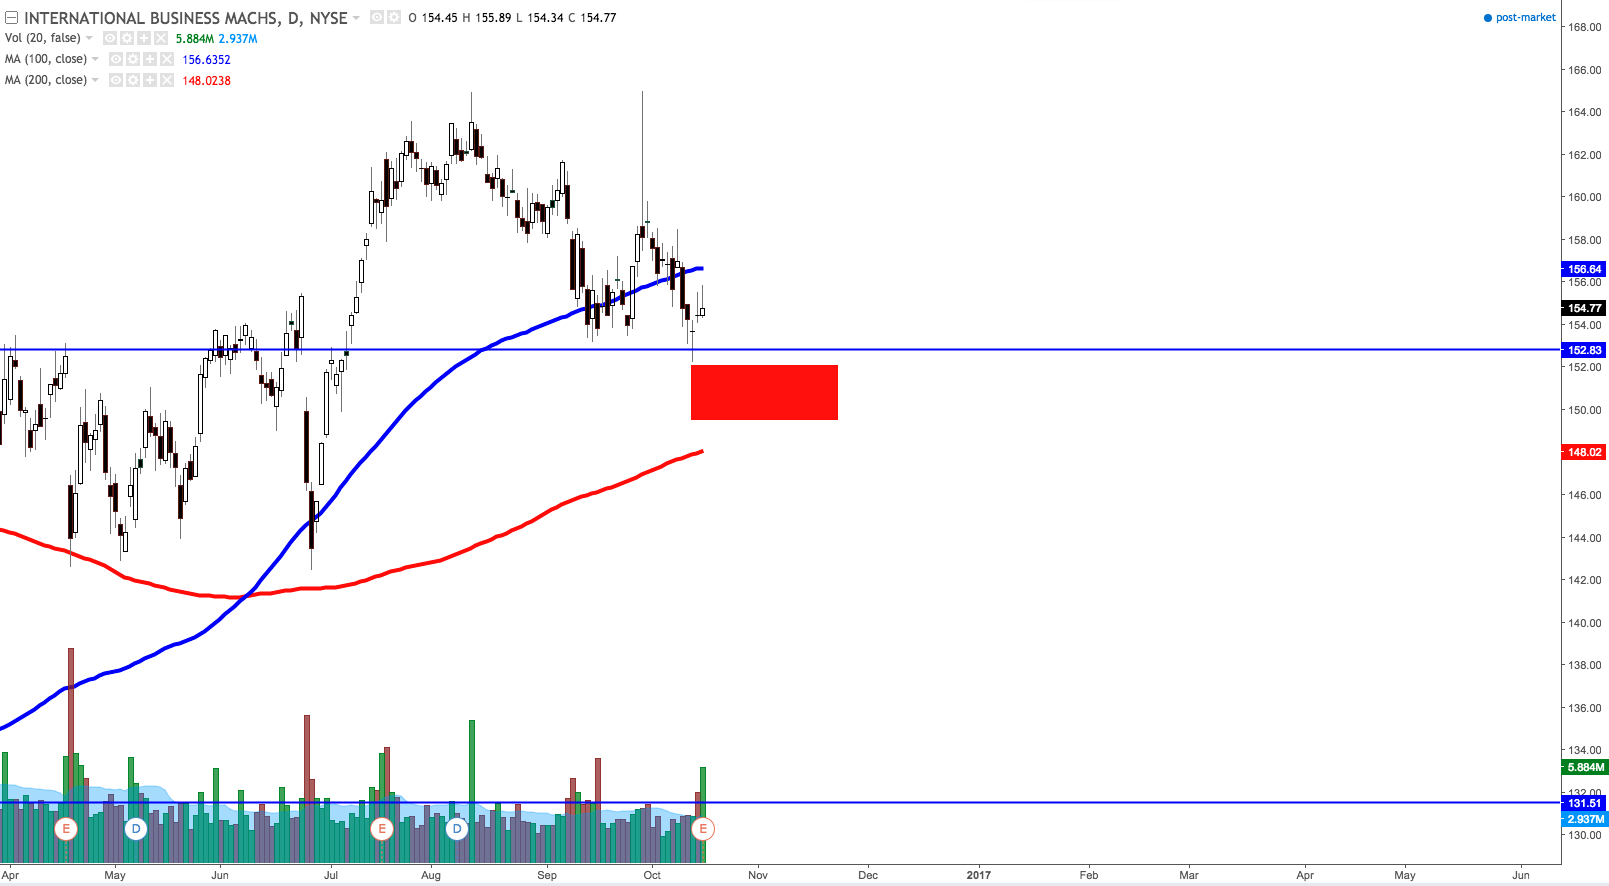
I expect the 200 SMA to become a support this week. IF IBM can open below $152 and above $149.50, I would look to buy the weekly $149 put (which expires this Friday) for approximately $1.50 limit. I’m not sure if that price will fill, but it could get close. My stop on that option price would be $.75. The chances of this trade filling depends on how IBM opens and its volatility.
As I write this, much can change in the morning. Just know I’m looking to be bearish because this gap {so far} doesn’t look bullish, but it will be all about the open on this chart.
It’s a very specific range where I think a lot of short term bullish traders have their stop and IBM could run quickly if it opens right.
Have fun traders! Keep your risks small and manageable and always trade your plan!
Feel free to watch this video to learn more about how I swing trade gaps.
Jerremy Alexaner Newsome
CEO of Real Life Trading.

