

In our July post charting British Pound futures, we identified a support area that could initiate a modest fourth-wave upward correction. However, price fell hrough that support during the summer and is now approaching another potential support.
Cautious traders might view this as a signal to lighten up on existing short positions, while more aggressive traders might begin shopping for long positions.
On a monthly time frame, the Pound appears to be near the end of a strong downward third wave inside what should be a five-wave sequence. Fibonacci measurements of the smaller moves within wave [iii] identify the area near 1.2120 as likely support, and channel geometry agrees with that idea. Price recently tested the level, while a major harmonic of the channel can be found only slightly lower.
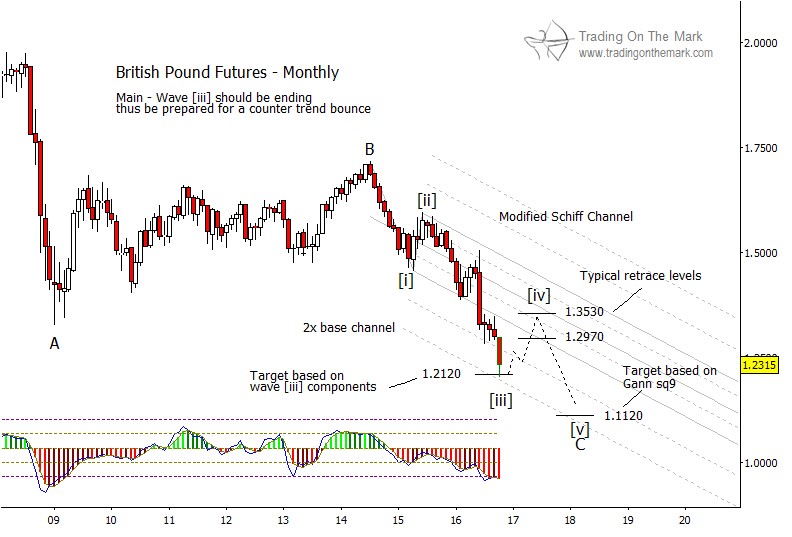
If price finds support nearby, then typical retracement targets for wave [iv] would be near 1.2970 and 1.3530. We will be able to refine those levels when it becomes clear that wave [iii] has truly reached an end.
In addition to the Fibonacci retracement values, the major channel lines also should act as resistance during a bounce. Ideally, price would intersect the Fibonacci levels and the channel lines at approximately the same time.
The Pound’s weak performance during the summer suggests that it can go considerably lower than we projected in our July post. Although we do not believe it will reach parity with the U.S. Dollar, there is an attractive Gann square-of-nine support level near 1.1120 that could be tested sometime in 2017 or 2018.
There’s more! This is the final week for traders to take advantage of our special 20% discount offer on all new subscriptions to our daily and intraday charting services. Claim your discount by using the coupon code 4FB2A when you follow the link on our subscription page.

