
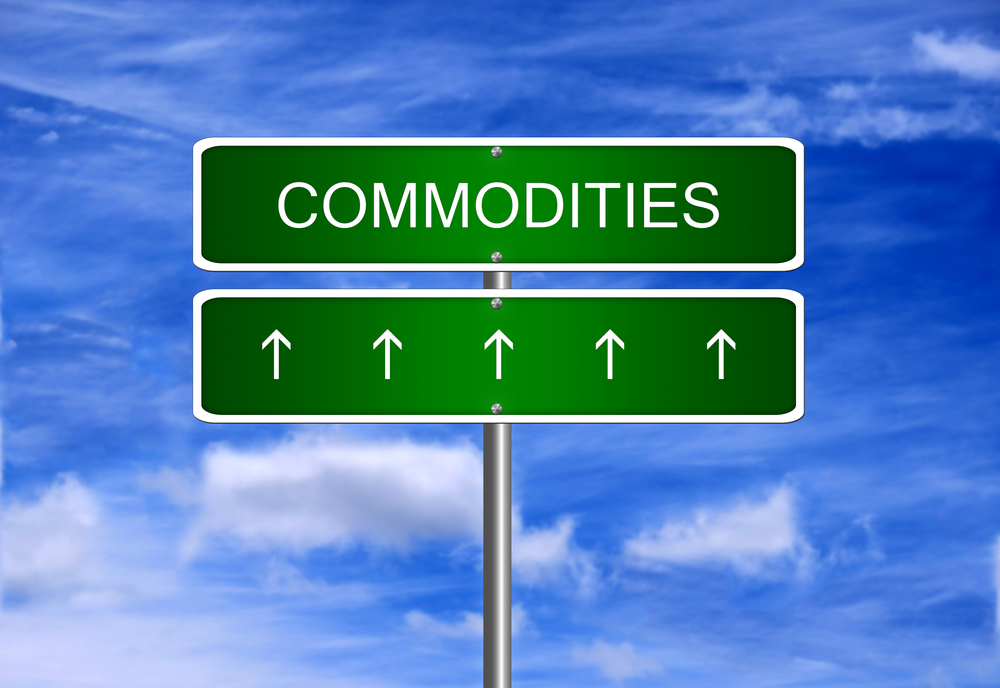
In early 2016 it felt like the commodity meltdown would suck the life out of the high yield debt market and drag the global economy down with it. Fast forward to October and things have turned out much better than most had feared. Much to the chagrin of those betting on the return of $10.00 crude oil and $1.00 natural gas, the energy market perked up and seems to have discovered a certain amount of balance in regards to supply, demand, and market stability. In my estimation, the commodity recovery will continue but it will not be without some near-term resistance from the energies. Although it was the energy sector that led the commodity indices higher in recent months, going forward the upswing will likely be attributable to the grains, meats, and maybe even the metals markets.
There are two commonly monitored commodity indices created to help investors track the performance of commodities as a whole. The first we look at is the Goldman Sachs Index. This is probably the most used and quoted, but it is also the least accurate due to its massive weighting in the energy markets. Nevertheless, it is worth a look.
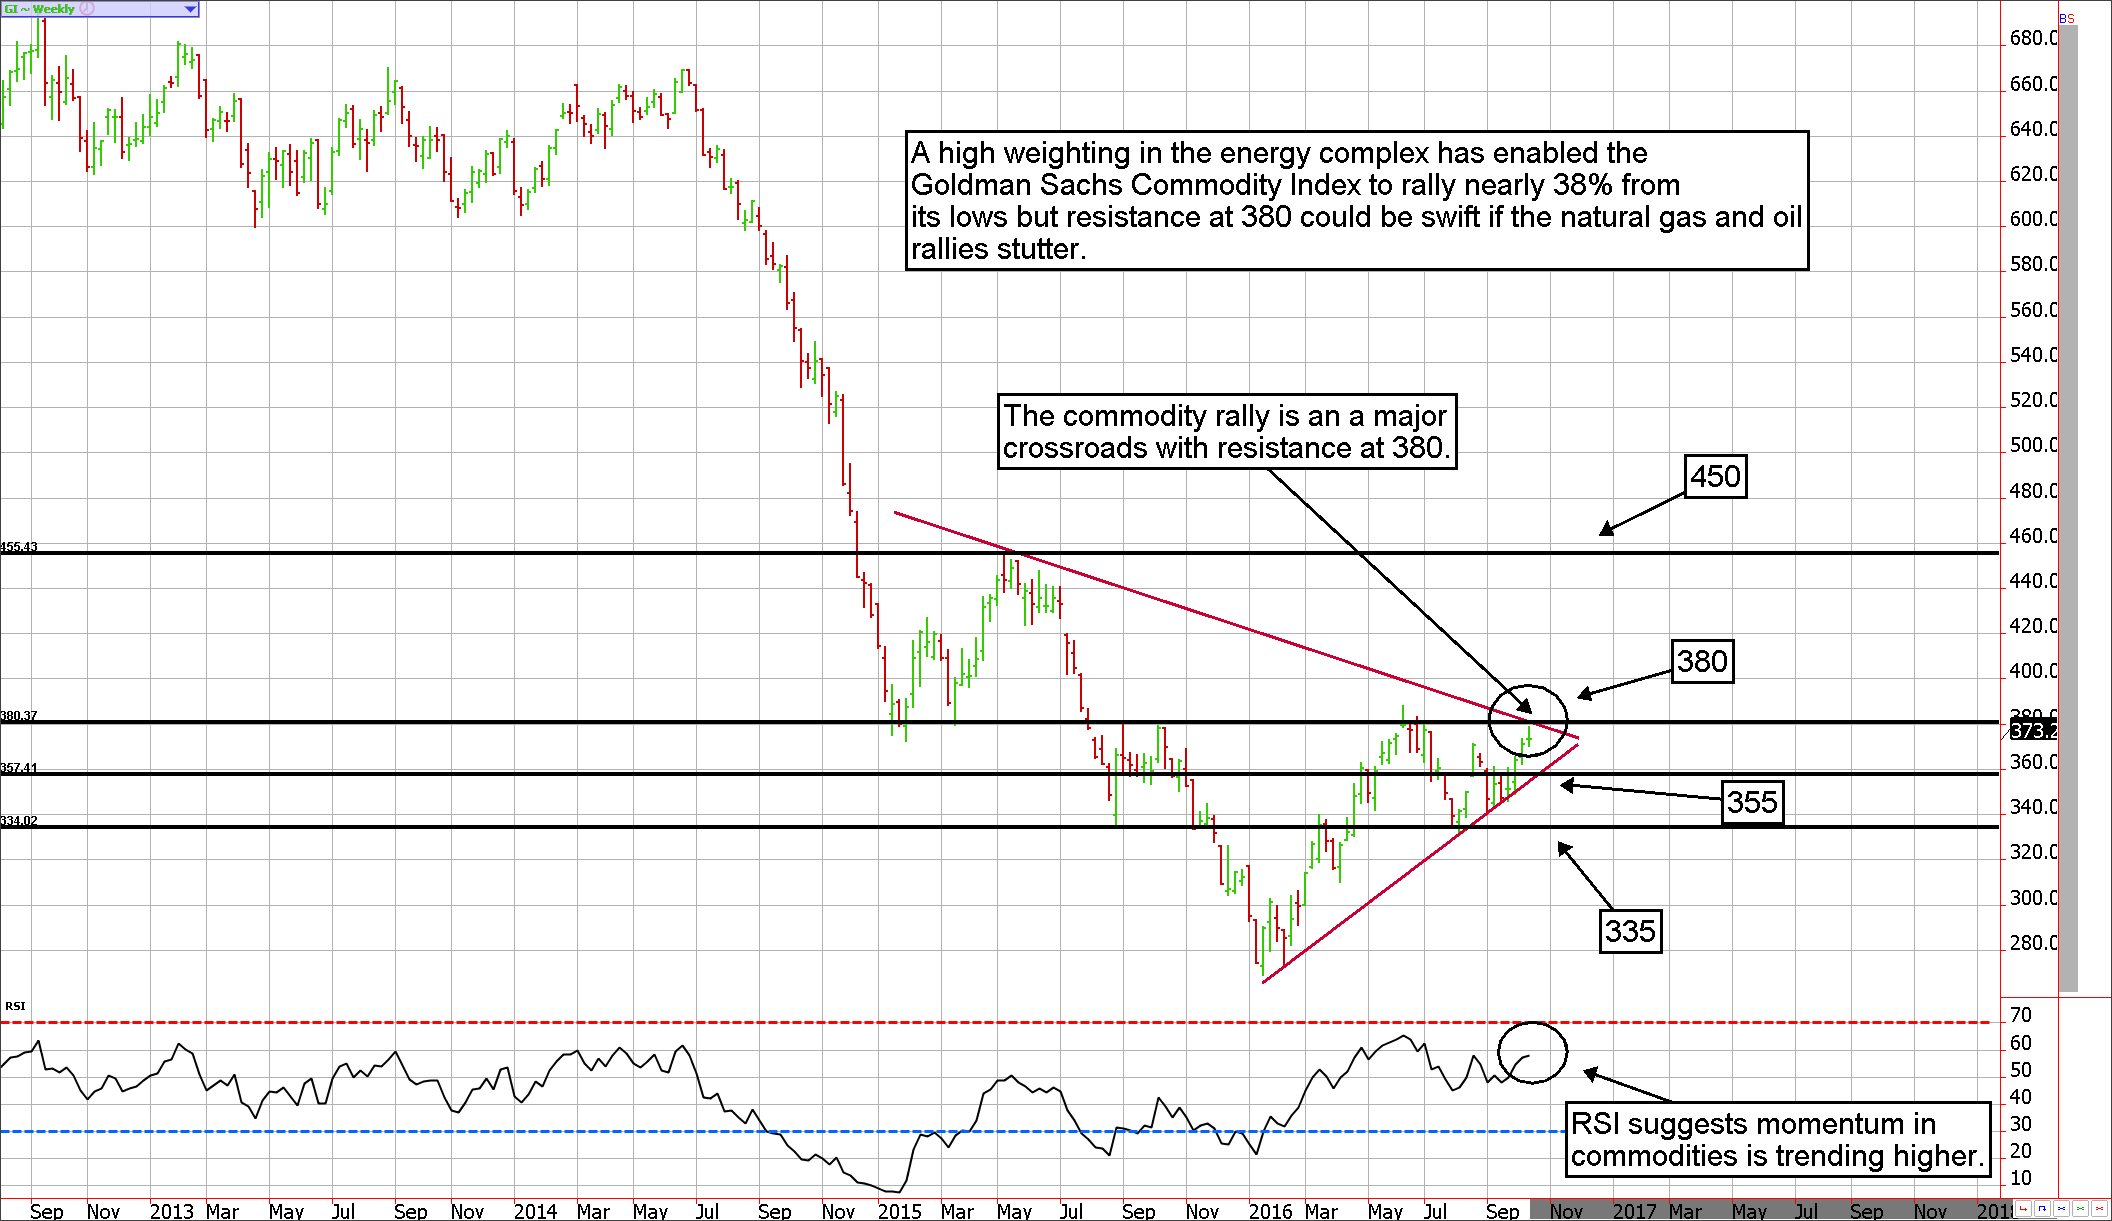
The Goldman Sachs Index has rebounded nearly 38% from the January lows compliments of recoveries in oil and natural gas. According to the Relative Strength Index on a weekly chart, which is hovering in the mid-50s, the commodity index has some room to move on the upside. This is because a market isn’t considered to be over-extended until the RSI reaches 70.
A move into the mid-400s is a likely scenario if prices break above trendline resistance near 380. While we do believe this will occur at some point, we also believe weak seasonals in the energy complex will likely cause this index to pull back before a breakout occurs. Yet, previous support near 335 should prove to be enough to fend off any return to a bear market in commodities. In the meantime, the market might find minor support near 355. Because of its flaws in weighting, one shouldn’t conclude that weakness in the Goldman Sachs Index is representative of commodities as a whole.
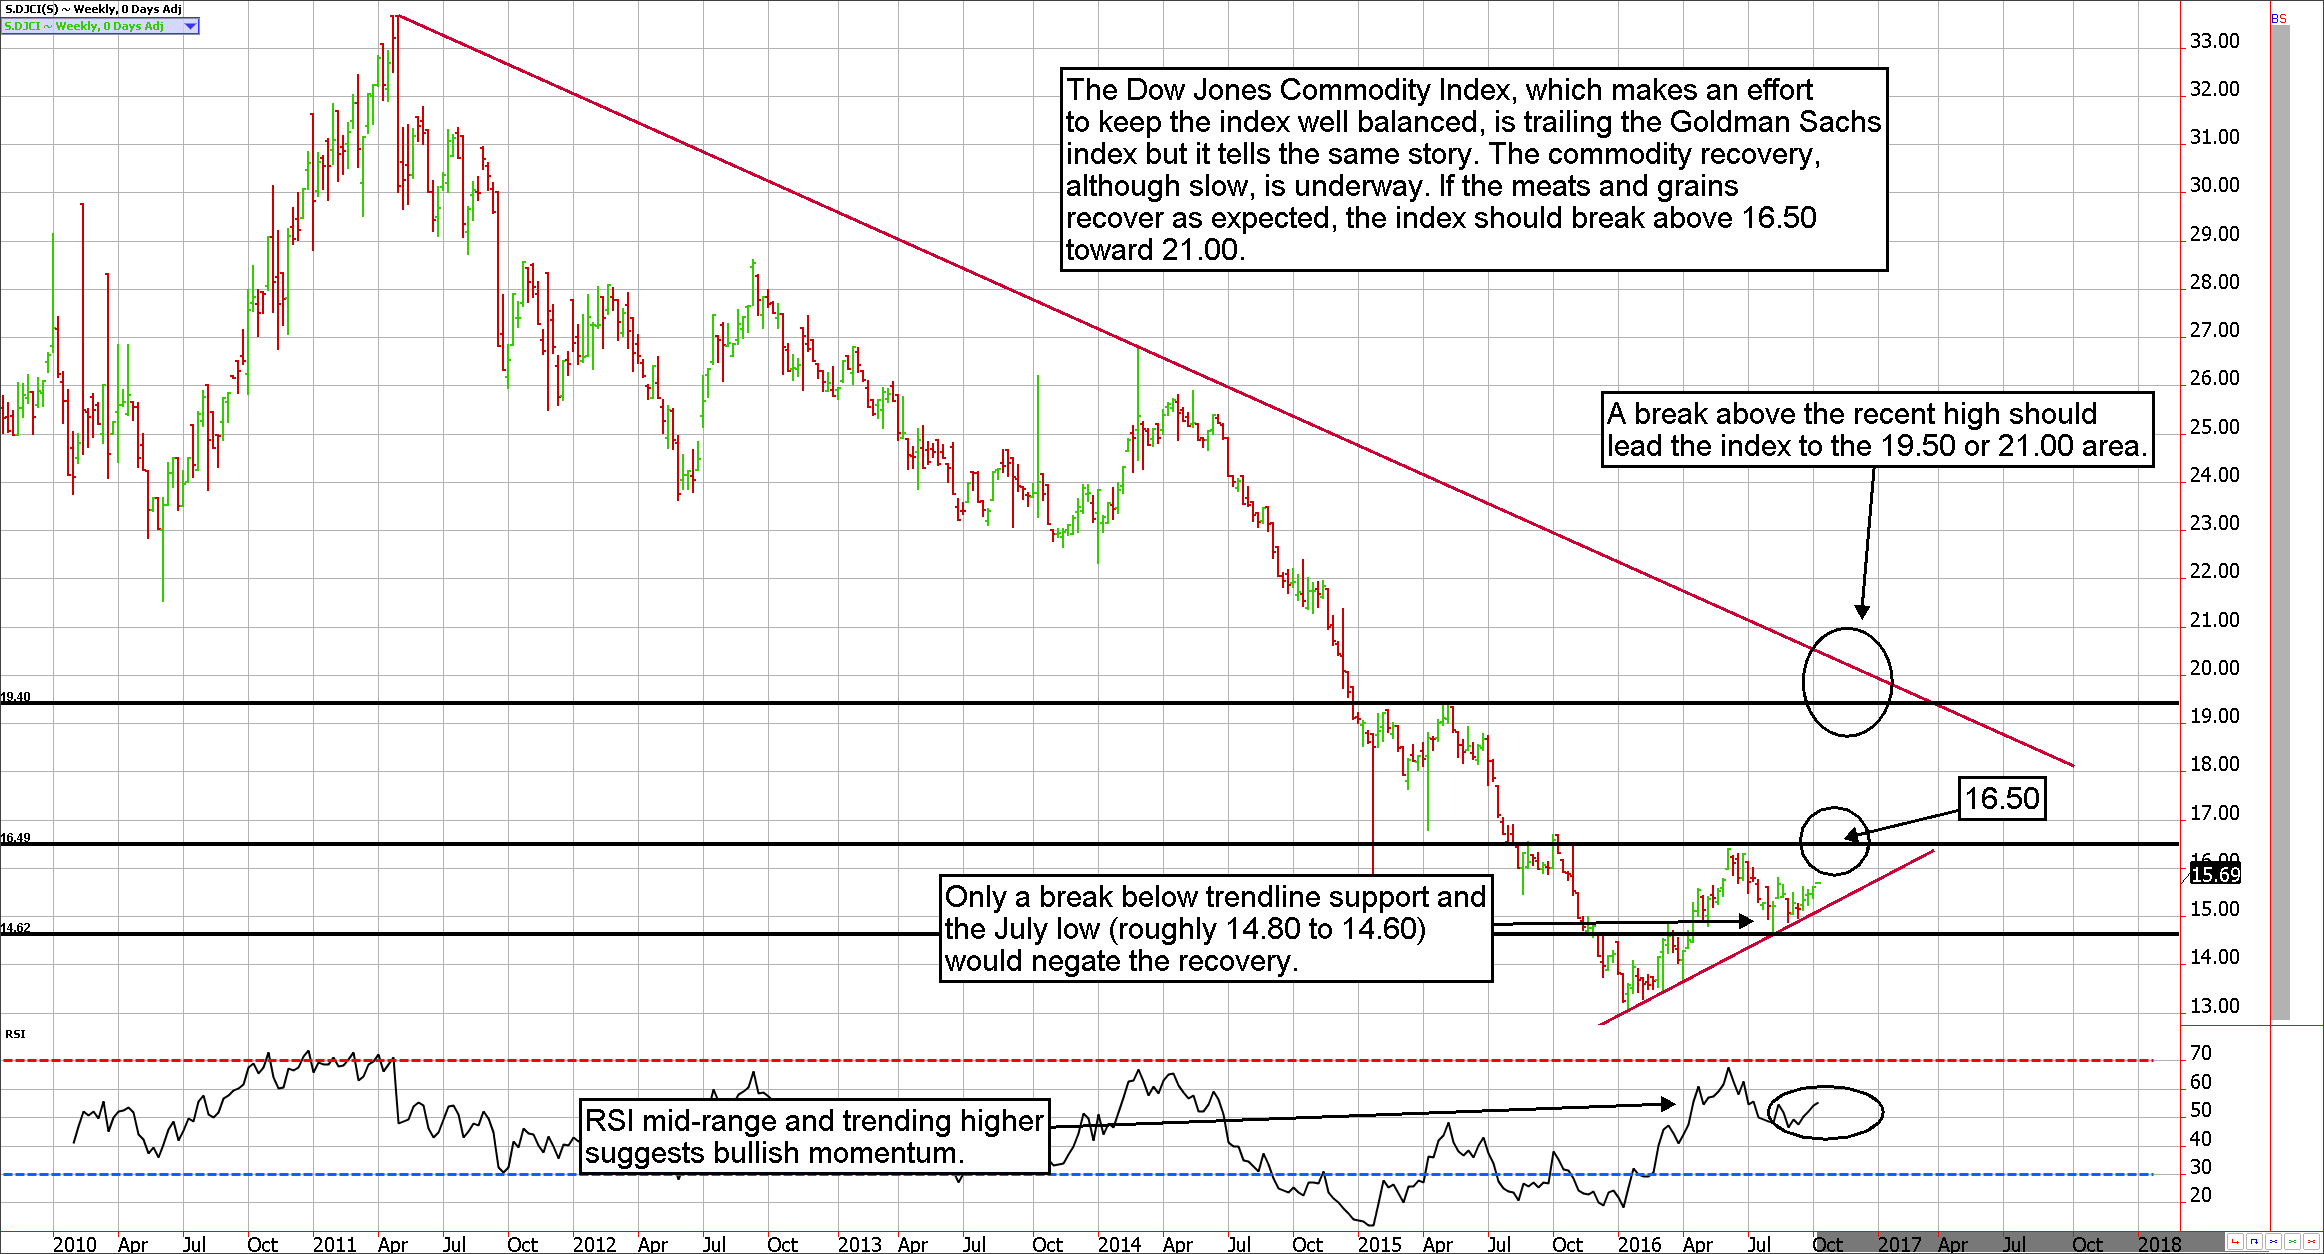
A much better-balanced commodity index is the Dow Jones version. This index is showing a much tamer recovery from low to high of about 9.5%, but it is a better argument for a continuation of upward momentum. Similar to the Goldman Sachs Commodity Index, the RSI on a weekly Dow Jones Commodity Index is relatively mid-range with plenty of opportunity for positive momentum. However, unlike the Goldman Sachs version, the more reasonable balanced index has yet to reach technical resistance. The Dow Jones index won’t run into resistance until reaching 16.50. (another 5% to 6% from the current price). This suggests the bears don’t have much of an argument to act in the short-run.
In my opinion, the Dow Jones index has a probable chance of breaking above 16.50 and moving toward the 21.00 level as depressed commodities such as corn, wheat, soybeans, hogs, and cattle return to a more natural price level (corn is flirting with being beneath the cost of production). Yet, despite a relatively small energy weighting in the Dow Jones Commodity Index, the energy sector will probably be a drag. Nevertheless, as long as prices stay above the previous swing low near 14.60 the commodity bulls will remain in control of the complex, there is also trendline support near 14.80.
The natural gas rally might be out of “gas”
In contrast to what conventional wisdom suggests, the price of natural gas generally declines during the winter months. This is because the demand for natural gas occurs in advance of seasonally cold weather as energy distributors stock up in anticipation of consumer demand. From there, whether or not natural gas continues higher will depend on weather forecasts. Of course, if the frigid weather is harsher than expected the price of natural gas has the potential to explode. Yet, on most years the market has sufficiently priced in the needs of consumers in advance; as a result, the price of natural gas has a strong tendency to decline. In fact, according to the accompanying chart by MRCI Inc., the seasonal peak often occurs on, or around, October 11th.
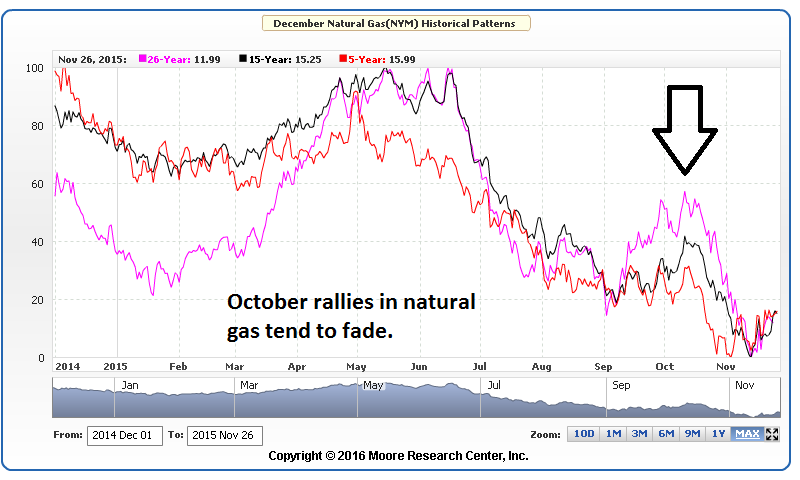
Further, MRCI (Moore Research Center, Inc.) stats suggest selling the April natural gas futures on October 11th and then offsetting it on November 30th has produced a positive outcome 93% of the time over the previous 15 years. Although there is a definite pattern here, the risk of being a natural gas bear during the winter months should not be overlooked. Even years in which this speculation is profitable can produce a rough ride for traders as the market discovers price based on the latest weather forecast. Further, although $3.50 natural gas seems expensive based on the fact that prices have come from levels under $2.00 in early 2016 but zooming out to a longer time frame reveals that prices are still trading at roughly 50% of the 2014 high and at a mere 25% of the 2008 high. In short, natural gas prices aren’t as expensive as they feel.
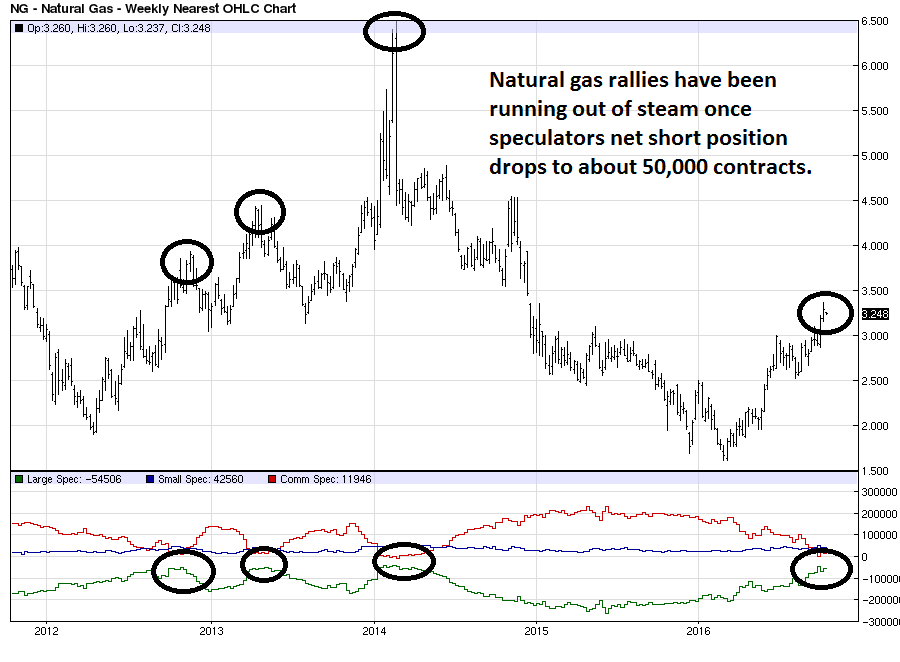
In addition to weak seasonal tendencies, natural gas rallies have had a habit of fizzling once large speculators identified by the Commodity Futures Trading Commission’s (CFTC) Commitments of Traders Report (COT) cut their short position to about 50,000 contracts. The large speculator category of the report identify those traders with deep pockets and large positions in the futures markets. Large speculators have been perpetually net short natural gas futures in varying degrees since 2007 and have refused to offset all of their short positions or convert to a bullish position; anytime this group gets close, as they are now, they tend to start selling again. The only scenario in which they will be willing to change their overall long-term position will be in the event they are forced to by the hands of a raging bull; even the massive 2014 rally into the mid-$6.00s wasn’t enough to do it.
The weekly chart of natural gas is a good representation of the current environment. Technical oscillators have become extremely overbought at a time in which the price is approaching trendline resistance, yet the magnificent 2014 high stands as a reminder of the treacherous nature of a winter weather natural gas rally.
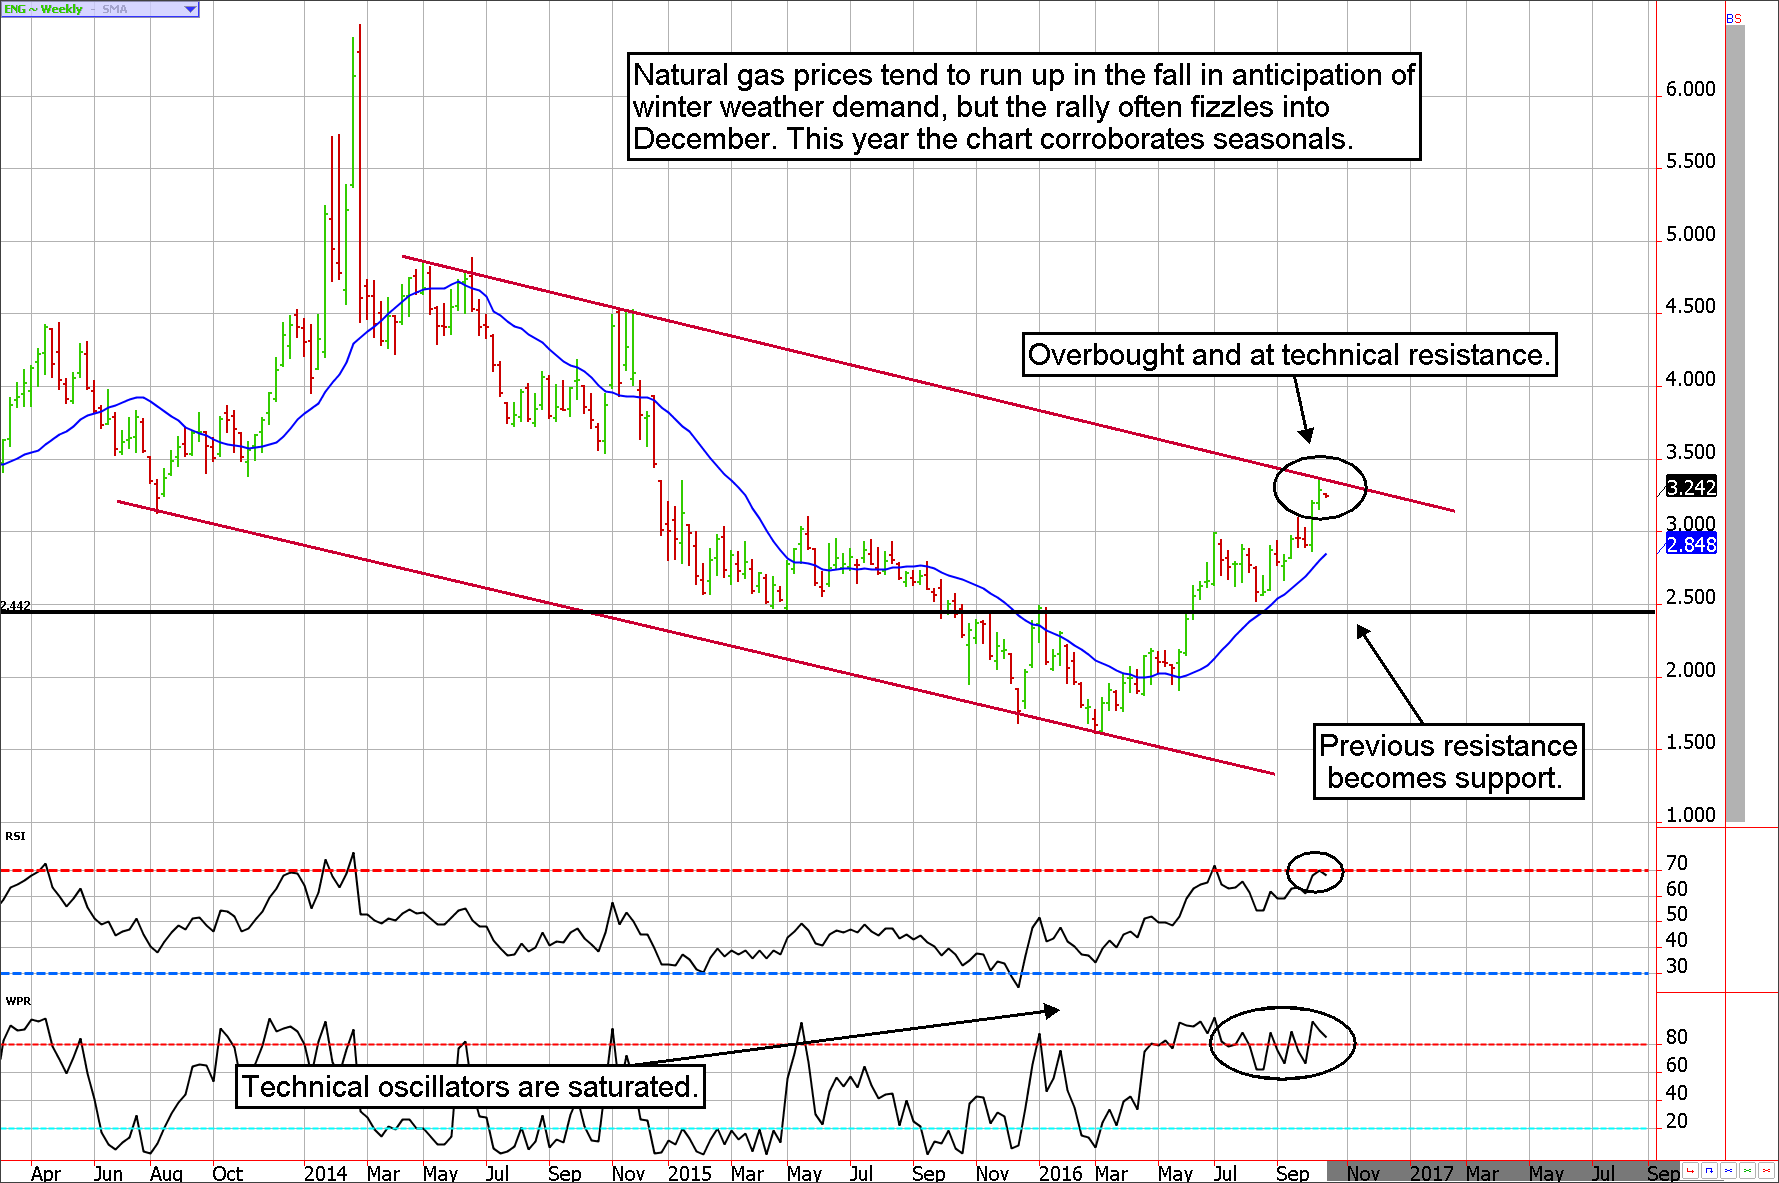
With an RSI (relative strength) reading near 70 and a W%R (Williams Percent R) showing above 90 it will be difficult for the bulls to keep the momentum going in natural gas. Without a significant surprise in weather, natural gas buying will likely dry up but the risk of being wrong in this regard is substantial. Thus, it is time for the natural gas bulls to proceed with caution. Those interested in being a nat gas bear should be reminded of this market’s nickname, “The Widow Maker”. Should prices retreat to the mid-$2.00s on seasonal weakness, which previously acted as resistance on the way up and will now be supportive, it should be a great opportunity for the bulls.
Carley Garner is the Senior Strategist for DeCarley Trading, a division of Zaner, where she also works as a broker. She authors widely distributed e-newsletters; for your free subscription visit www.DeCarleyTrading.com. She has written four books, the latest is titled “Higher Probability Commodity Trading” (July 2016

