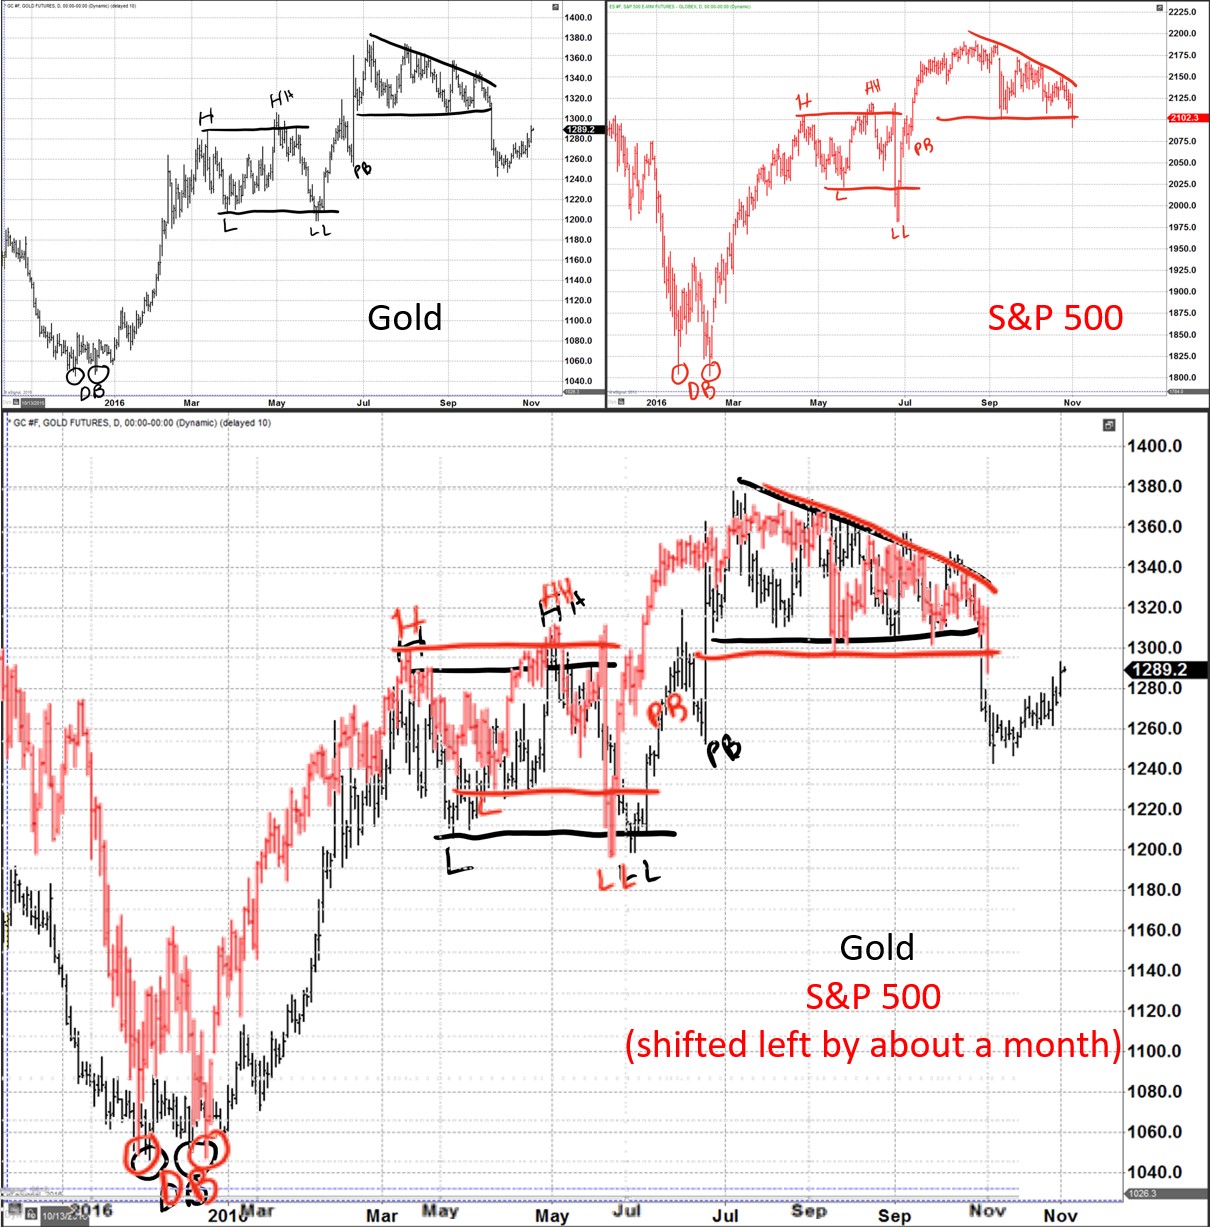
The title does seem a bit sensationalist I’ll admit. In my defense, I’ll offer the following simple comparison and let you be the judge.
Click here to watch a video explaining how to read markets using volume at price.
In the picture below, the upper left panel is showing gold futures and I have a few different points on the chart annotated beginning with the double bottom (DB) just prior to the turn of the year.
In the upper right panel it’s the S&P 500 futures along with some annotations also beginning with a double bottom (DB) just after the turn of the year.
In the large lower panel, I have overlayed the gold chart with the S&P 500 chart but I have shifted the S&P chart about a month to the left.
As you look at that lower overlay, I think you’d have to acknowledge that so far this year, the gold market seems to have telegraphed every major move in the S&P 500 about a month in advance.
Is there a logical reason for this? Is it pure coincidence? You be the judge.


