
Let’s talk about the hourly time frame. I personally feel this is an excellent time frame for finding day trades, or swing trades with. I often call it ‘the bill paying time frame’ because even if you’re trading something like NKE, DIS, JNJ or KO, you can still find great trading opportunities on the hourly charts.
You can use the hourly time frame with either extended (after hours data) to get an even more comprehensive view of what’s going on. Or the regular hourly charts without the pre / post market data and still obtain some very useful support and resistance levels.
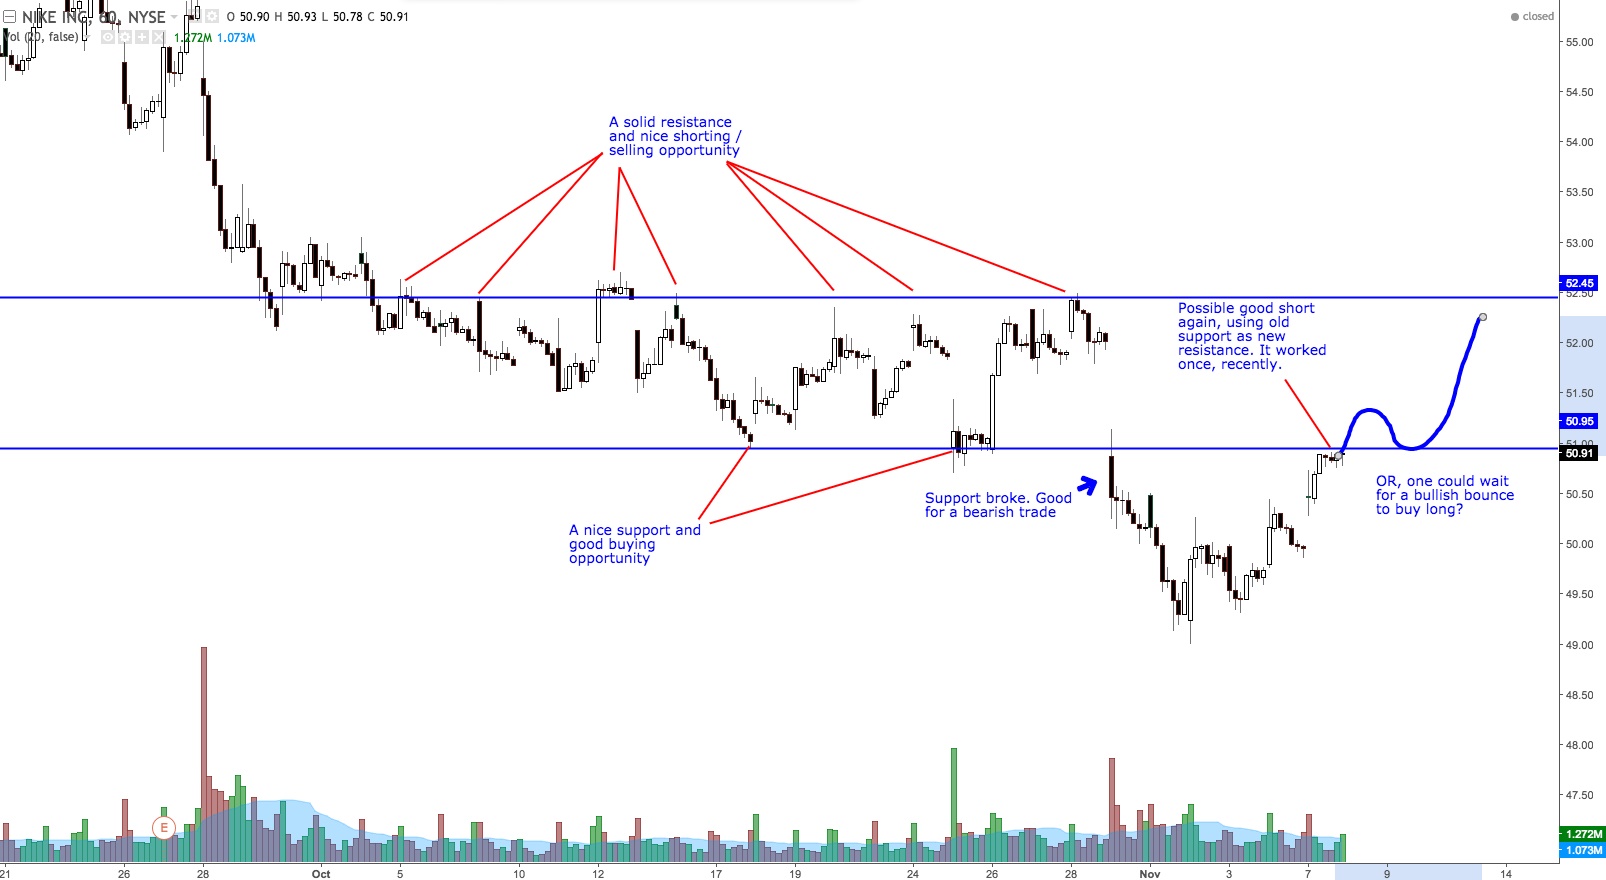
Speaking of NKE, here’s an example. With no other indicators used, one can easily and quickly create two lines. A support / resistance price and play the set ups accordingly.
This method of trading is really one of my favorites and you’ll see a more in-depth description of the hourly chart and analysis combining the use of moving averages in this FREE video.
Enjoy and if you have any questions at all, please let me know! You rock!

