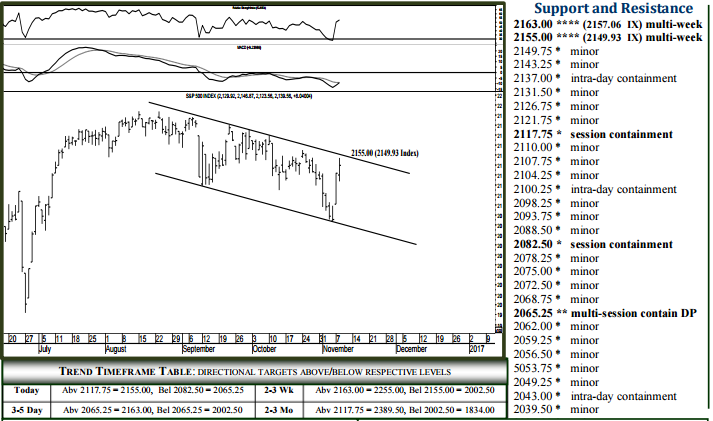
Devoid of overnight volatile trade, the underlying S&P 500 index illustrated above presents a more “civilized” and sensible technical structure, with meaningful overhead resistance in the 2155.00-63.00 region (2149.93-57.06 index values) able to absorb buying into December trade and below which the market remains susceptible to testing 2002.50 over the next week or two (day or two?) where the market can bottom out through December trade. A daily settlement below 2002.50 maintains a heavy dynamic through the balance of the year, ultra-long-term support at 1834.00 then anticipated over the next 2-3 months. Upside, a daily settlement above 2163.00 (2157.06 index) maintains a constructive dynamic into December trade, 2155.00 then becoming a 3-5 week target, higher levels anticipated into Q1.