
What a monster week. US ETF Index performance (5d): SPY +3.8%, DIA +5.5%, IWM +10.1%, QQQ +2.0%, TLT -7.4%, GLD -5.9%. The above numbers speak for themselves. Last week was a culmination of cash being put back to work in equities and jockeying for stocks and sectors that will benefit under a new political regime. Regarding the cash being put back to work, this is evidenced of the massive Equity ETF flows last week of $31B. That’s right, $31 Billion w/ a B. We don’t need to speculate where investors / funds are putting their money – Financials +$4.9B, Health Care +$3.1B, and Industrials +$2.3B saw humongous inflows. That is why I watch the ETF fund flows – there are few certainties in investing but inflows are outflows are what they are – proof of where money is going. Note, it wasn’t all rainbows and butterflies for equities… equity bond proxies suffered (XLU -4% XLP -2%) as TLT -7.4%. The same in International areas, especially in Emerging Markets with Mexico EWW -12.2% and Brazil EWZ -8.1%.
This brings me to my next topic – know thy market. I’ve mentioned this in the trading room but I think it’s worth repeating. Implied correlations are at a multi-year low. Meaning stocks are not moving together. Why is this important? Two reasons: 1. I always want to know what type of market it is therefore I can make decisions to capitalize on the current environment. To me, this is currently a long / short style market. Translation: one can have longs and shorts and make money on both sides (of course the correct investments have to be chosen). 2. As an individual investor you have an advantage over funds in this regard. Why? You are not mandated to trade the same style! You can change as you see fit, some funds may not have the flexibility to do this if they are mandated to be a long only fund.
A couple other one off points that I view as positives. Earnings season is coming to an end. I don’t like earnings season for two reasons: 1. It’s noisy. One never knows if an option trade is a hedge around a company’s earnings report 2. Company buy back plans are in quiet periods around their earnings – meaning they cannot buy shares in the open market. So, as earnings season is coming to an end, companies will begin to buy shares back in the open market again (if they have buyback programs) and this is a positive for equities.
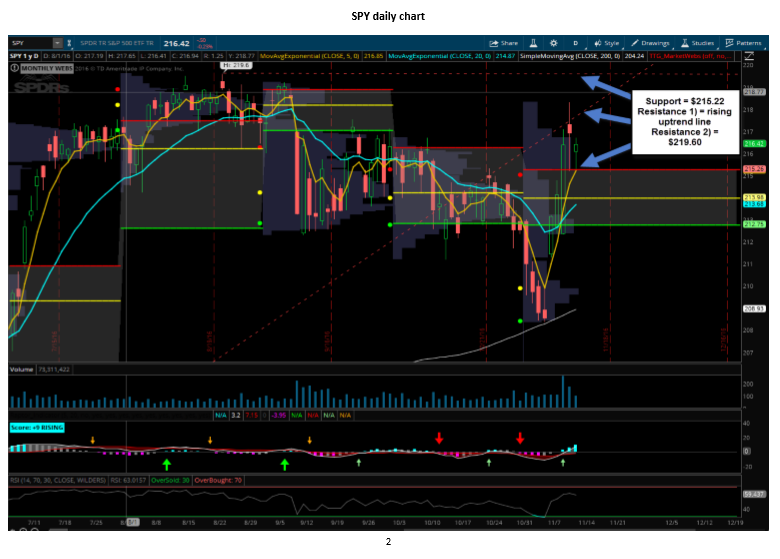
S&P technicals: SPY is now back above the monthly value area – this is a good thing for bulls.
Watch to watch going forward:
1. support = $215.22 (top of value) 2. The moving averages (MA): last week the S&P found support at the 200d MA and we are now above the 50, 100, and 200d MA which is bullish 3. The upward trend line (dotted red line below): this is short term resistance 4. Previous high of 219.60: next resistance
One final point: as I stressed above, we are in a stock picker’s market… so, while I’m showing S&P technicals because it is the most widely following index in the world, I really think the S&P 500 may be a slow mover because of the low implied correlations that I mentioned above (i.e. some sectors in uptrends / some in downtrends).
US sectors changed dramatically from last week. Financials, Energy, Industrials, and Materials are now all over the 50d MA and I view them as strong. My favorite of the sectors is the Materials. I also like the Financials & Industrials if they pull back a bit as both ran up tremendously last week. The Defensives are all under the 200d MA and other than for a day trade, I see no point in being long this group. Tech & Consumer Discretionary are neutral.
Conclusion: Stocks and sectors ETFs are where I am looking for opportunities rather than owning the major indices. While I now have more of a bullish stance, I will still look for long / short opportunities but will be more skewed to the long side.
LEARN MORE ABOUT CHRISTIAN’S NEWSLETTERS, TRADING ROOM AND WEBINARS AT TRIBECA TRADE GROUP

