

The outcome of the US presidential election surprised everyone, including the markets. On election night, the S&P futures collapsed into a limit-down halt of trading. Yet the next morning, a spectacular rally unfolded. Using multiple time frames and a calm mental attitude gave the edge in dealing with the high volatility.
The market shifted rapidly from down to up as the uncertainty of who would be the next US president became clear. We’ll look at two trades using the 15-minute and 3-minute charts for entry, trade management, and exit.
Trade 1 Setup
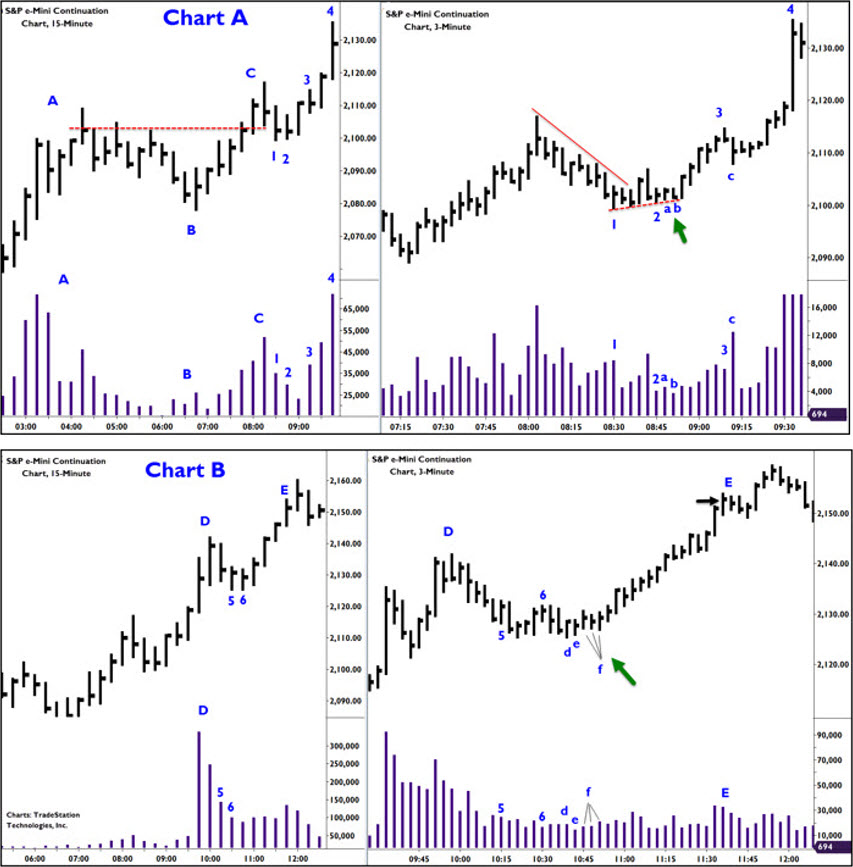
Chart A shows the 15 and 3-minute charts of the S&P e-Mini in the hours prior to and into the US open. The 15-minute chart shows clear up trending conditions. Note how the volume expands on the rallies A and C, but recedes on the reaction to B. This is a hallmark characteristic of trending conditions. Given this, we look for a long trade opportunity.
As the market pulls back from C on the 15-minute chart, we see the volume again recede at bars 1 and 2. The astute trader notes that the pullback is coming into old resistance at the last swing high. This should now be support (red dashed line), and her ears perk up. She is alert to a potential trade setting up.
Trade 1 Entry
Bar 1 on the 3-mintue chart marks the 8:30 time period on the 15-minute chart. Although the 15-minute is showing diminishing volume at bar 1, we see volume increased to the downside on the 3-minute. The increased downside volume indicates supply remains present; we could see further downside. A long at this point is contraindicated.
The 8:45 bar 2 on the 15-minute chart shows a further decrease in volume, indicating selling is drying up. This is also seen on the 3-minute chart. Importantly, the supports or lows are lifting (red dashed line), a bullish indication. Further, we see that the down trend (red solid line) has been broken, another bullish indication. Long trade opportunities present at 3-minute bars a or b, with bar b being a classic test where the market has been pushed down slightly, but volume is very light, indicating sellers were not active. Your stop goes under bar 1.
Trade 1 Management
The market rallies nicely to 3 with volume expanding to the upside on both charts. We do get a bit of a scare on bar c, but the close is off the low and the next bars show no further downside – a shakeout designed to force early buyers into giving up their long contracts.
The market rallies smartly up into the US open at 4 and we see a sudden wide-range bar on heavy volume. Since this could be climactic—signaling a reaction, and the market has moved substantially up from entry, we view this as a gift and close the trade.
Trade 2 Setup
On the 15-minute chart, we see strong trending conditions to D. The pullbacks into 15-minute bars 5 and 6 reveal diminishing volume. Selling is not present.
Trade 2 Entry
At 15-minute bars 5 and 6 we see 30 minutes of trading unable to go lower. At 3-minute bar d, the swing lows are tested and no selling appears. Three-minute bar e is a classic test and a spot to go long. Any of the three bars labeled f are also good long entry choices. Because we are buying near the “danger point,” our stop is close—just under the low of bar d.
Trade 2 Management
From entry, the market rallies nicely. At E we see the price range expand, volume increase, and closes bunch up at the same level. This signals an exit.
Yes, the market did go a little higher. But I am happy with the trade. I don’t care about making the last tick, the only concern I have is trading market principles.
5 Tips for Trading Higher Volatility
Use wider stops. Higher volatility means more noise; you don’t want to be stopped out prematurely. Cut back on trade size to manage risk.
Cut trades quickly that aren’t working. You can often do this before wider stops are hit. Higher volatility means losses can increase, so when wrong exit.
Hang onto the big fish. When you’ve got a good trade on, hold it until the market tells you to exit. Profits can add up dramatically.
Keep an even keel mentally. Becoming overexcited will cause errors. Maintain calm.
Know that basic market principles show themselves on high volatility days. Usually, they are nice and clear. Become an expert in reading the market.
Reading the market by price and volume involves several known principles. You can learn more about these principles in a free webinar offered by author which details techniques to read price and volume. Just click here.

