

One of the benefits of Elliott wave methods is that they give you an antidote to the bias of popular sentiment. A lot of analysts seem to believe the price of crude oil can’t go beneath its early 2016 low, but a five-wave structure says it can.
During the next swing in the 60-week cycle in crude oil, between now and spring 2017, we think it is likely that price will work to complete the fifth and final downward wave in the (i)-(ii)-(iii)-(iv)-(v) sequence shown on the chart below.
You can see a larger view that puts the structure in context in a recent post at our website.
The move down from the 2015 high is behaving as an impulse, although there was a wrinkle that could throw some traders off that view. The small amount of overlap between the August 2015 low and the June 2016 high may have caused some to conclude that the idea of a downward impulse had been invalidated, but really the potential for a five-wave pattern is still alive. (Overlap between the first and the fourth waves is only a problem when it’s the ending part of the fourth wave that overlaps, and in the case of CL it was an intermediate part of the fourth wave that overlapped.)
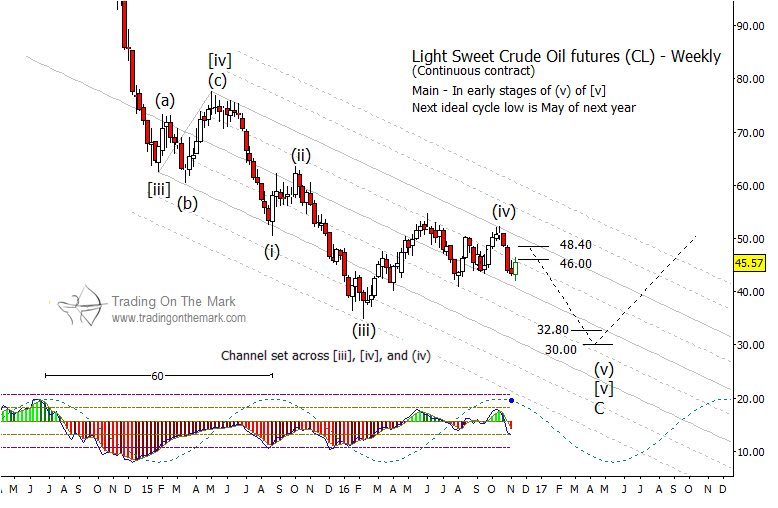
Going forward, we would expect to see the areas near 46.00 and/or 48.40 act as resistance. When a downward move begins in earnest, it should attempt to reach at least one of the Gann square-of-nine supports we have drawn at 32.80 and 30.00, and it is even possible that a move could try to test the bottom of the channel.

