There are effectively only three days of trading in the US equity markets this week, but this week is likely to be … well, a bit nutty.
The markets are closed Thursday for Thanksgiving, and close on Friday at 1pm. But everyone who can will take Friday as a holiday as well, leaving the trading desks in the hands of those who are too junior to duck.
That means the start of the week will see everyone scrambling to cram a week’s worth of trades into three days. Then the volume will be die. That makes it relatively easy to push the price around and generate mini booms and busts.
Small volume and price spikes without adult supervision on the trading desks will make the markets dance. Don’t hang around unless you know how to dance too.
And at the end comes Black Friday, when somewhere between 55 and 60 percent of American consumers will be doing what they do best: spending money they don’t have for things they don’t really need.
Black Friday, for readers outside the US who may be mystified by this annual madness, is the Friday after Thanksgiving and the biggest single shopping day of the year. Retailers hope about 130 million Americans will buy something, anything, over the three-day holiday weekend, and they are usually right. The average spend is typically more around $400 per shopper, although it has been trending down.
About 23% of customers confess to lining up overnight to get into stores and every year a couple of frantic shoppers are killed, either in the crush of a frenetic mob or in arguments over who gets the last 72-inch television. There is nothing like it anywhere else in the world, although UK retailers and the merchants of Hong Kong are trying to ignite similar buying panics.
For retailers, Black Friday starts the Christmas buying season, which accounts for about 30% of all retail spending. If they are going to show a profit for the year, that’s when they make it.
For the markets, it usually marks the beginning of the end-of-year rally, and that rally (which usually extends into January) often determines if the market is up or down for the year.
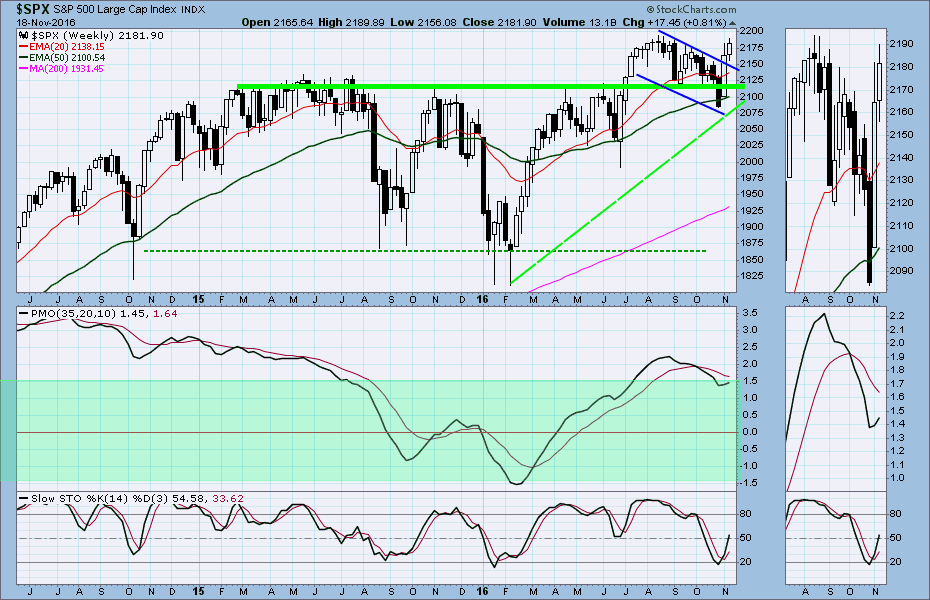
The rally has already started this year. The S&P500 cash index (SPX) is up roughly 100 points from the low it made the first week in November and is scratching at the all-time high around 2193. There are technical reasons to believe it will break above 2200, if not this year then early in 2017.
It closed at 2181.90 last Friday, up 17.45 points for 0.8% net weekly gain.
Our optimistic outlook doesn’t mean we are advising you to join the Black Friday buying panic. But despite the clear weakness in the US economy and the dramatic surge in the US dollar, the large-cap equity markets seem to have better chances of being up than being down.
The test will come December 13, when the Federal Reserve Open Market Committee meets again. The Fed is making noises about raising interest rates, as it has threatened innumerable times before. If the market starts to believe them, the large caps are vulnerable to a pullback. If not, our money is on a rally into the end of the year.
Today
For the S&P500 mini futures (ES)
The ES attempted to move higher last Friday but ran into resistance around the 2185 level, where there had been heavy buying in the options market.
Today the ES could repeat Friday’s trading, essentially a narrow 10-point range from 2177 to 2187.
However the overnight trading seems to be holding above the 2175 support level, and if that continues into the open there is a chance the ES will try to move above the August high at 2193.50.
If it does make new highs today or early in the week, there will be a spate of selling as profits are banked, especially if we see prices around 2197.50 to 2205, and especially as the holiday approaches.
The basic trading strategy this week is to buy on weakness and cover at new highs.
Major support levels: 2143.25-44, 2134-32.50, 2121-23.50
Major resistance levels: 2188-89.50, 2198.50-97.50, 2208-10.50, 2223.50-21.75
To see free professional analysis of futures markets for gold and equity indices, visit www.naturus.com
Chart: SPX daily chart, Nov. 18