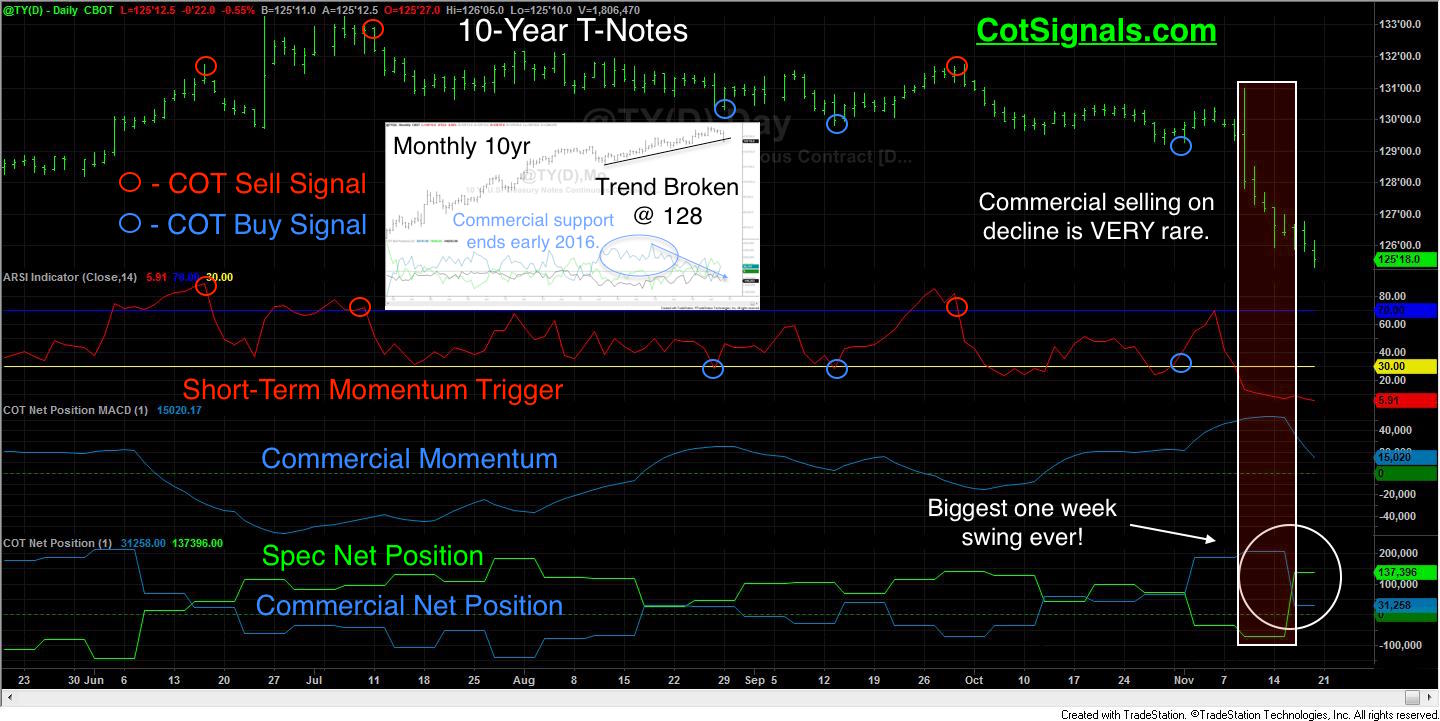
The post-election sentiment shift in the 10-year Treasury Note futures is unprecedented. The December futures made a high of 131^00 on November 9th and had fallen all the way to 12^10 at Friday’s low. This is a 4.3% decline in the futures price. More dramatically, this is a 24% jump in the implied yield of the December futures in just eight trading sessions. Finally, this move is a major anomaly in the typical behavior pattern of the commercial traders. This is so big; we had to insert a monthly chart into our standard daily chart to provide the proper context for the market’s recent actions.
Beginning first with the inserted monthly chart there are three primary points to be made. The commercial traders have been primarily bullish since the economic collapse. This has put them on the right side of this multi-year Bull Run to all-time highs in price and record low yields. Secondly, commercial support for the bull market was clearly withdrawn from the market in early June, ahead of the Brexit vote. Lastly, the recent trend on the monthly chart dating back to September of 2013 has now been broken.
Moving to the daily chart and our usual Commitments of Traders (COT) report chart, we’ll briefly note the standard points before closing with the current situation. The commercial traders are negative feedback traders. They have an idea of value on either the buy or, sell side according to their business needs. The further the futures prices are from this value area, the more of their future business needs will be locked in at better margins. It is the collective actions of industry groups that provide the support and resistance upon which we base our swing trading. These trades are plotted on the chart in our usual fashion. We only trade with commercial momentum and use our proprietary short-term momentum indicator to trigger reversals in markets that are overbought or, oversold against the commercial traders’ collective market sentiment as expressed by the MACD of their net position.
Notice our last COT Buy Signal, published on Halloween. This pre-election trade was based on commercial traders buying into an oversold market. This is their typical behavior. However, during election week, and I’d imagine post-election, the tables turned in record fashion. The COT report shows the biggest one-week swing in commercial and speculative traders, EVER! Commercial traders sold more than 175k contracts on the market’s decline while the speculators bought more than 208k contracts. These are both individual trading group single week record moves, as well. Even more notable is the fact that commercial traders were selling on the market’s decline. This is exactly the opposite of their standard actions and is exceedingly rare.
The current state of flux in the financial markets has us searching for clues to long-term predictions. The commercial traders’ collective selling as the market fell through its multi-year upwards trend strongly suggests that this is a macro event. One final piece of context, the commercial traders dominate the 10-year T-Note market with a total position nearly three times the speculative position and their record net short position is more than (400k) set in 2007. Therefore, we’ll continue to follow their actions and trade accordingly.
You can have these signals delivered nightly to your email free for 30 days at CotSignals.com.