

As we head into the Thanksgiving holiday, US stock indices are notching new record highs and many investors are thankful for their growing account balances. If you’ve missed out on the ride to these lofty levels, let me share with you how can be sure to get (and stay) on the right side of these moves.
Click here to watch a video explaining how to read markets using volume at price.
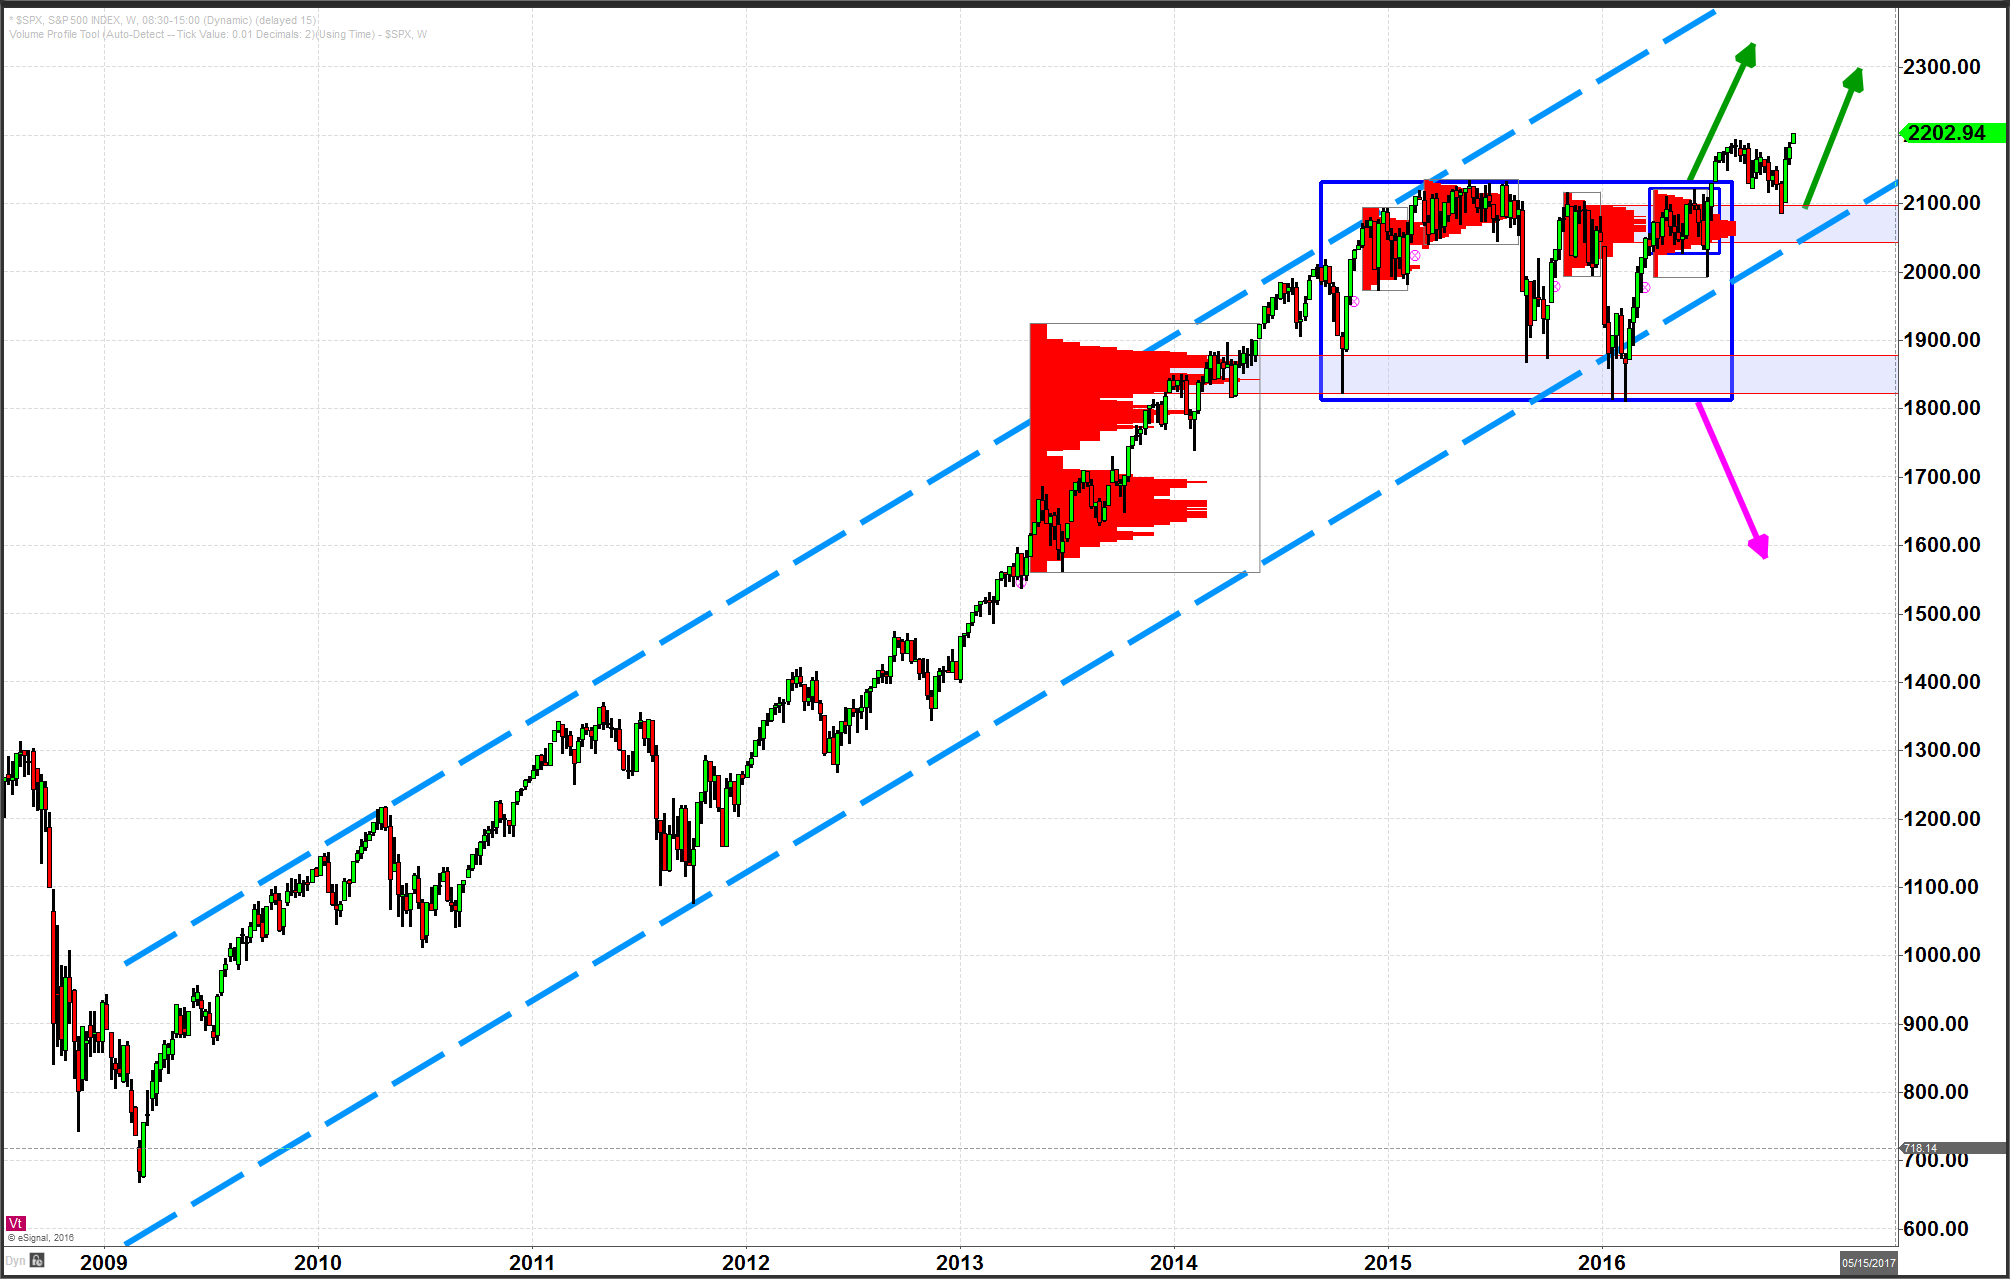
As you can see in the chart, the S&P 500 index spent 18-months over the course of 2015 and early 2016 in a large consolidation range (large blue rectangle). Following the Brexit vote this summer, the SPX broke out to the upside. This re-established the big picture bullish bias that has been in force since the low of 2009. On this most recent pullback, you can see the index perfectly touched to the most recent high-volume area support before re-asserting back to the upside. This is typical bull market behavior and understanding the volume-at-price structures and observing the price action around these important areas will tell you the story of the market and whether its a bullish or bearish story.
Happy Thanksgiving!
Free video training on How To Read Markets Using Volume-at-Price, click here.

