

One of the most interesting equity trading concepts out there is that of pairs trading. Many institutional investors have used this strategy to make considerable returns on their positions.
Equity pairs trading is the concept of taking a view on the historical correlation between two equity pairs over a period of time and whether this correlation will continue. This strategy also does away with a lot of the uncertainty inherent in Macroeconomic factors which impact on country or industry group as a whole.
What is Equity pairs Trading?
Equity pair trading is when two stocks are entered into, where the trader goes long the one pair and short the other. These two equities would have to be very similar and their share prices would have to normally move close to each other.
An investor can either take a long view or a short view on the pair. In other words, the investor can take the position that the pair will continue to diverge (going long the spread) or that the pairs will return to their original pattern and mean revert (going short the spread).
This spread is monitored by investors and the spread is analyzed using technical and fundamental analysis.
Selecting the Equity Pairs To Trade
When choosing the individual stocks to enter a pair trade with, there are a number of indicators one can look at. These include metrics such as industry groups, Market Capitalization, PE ratios and other multiples.
When the investor has found the ideal stocks that he would like to enter a pair trade for, he should set the stocks up as a dollar neutral trade. What this essentially implies is that the same amount of capital should be invested on both the long and the short side of the trade. It also means that the purchase of the long shares will be paid for with the sale of the short shares.
Having a dollar neutral trade also ensures that the investor is only exposed to the movements in the value of the pair and not to the volatility of the combined stocks.
An Example of an Equity Pair trade
In this example, we will set up an equity pair trade on two very similar payment processors, namely Visa and Mastercard. Both companies are relatively the same size and operate in the same industry and have maintained a relatively close correlation over the past few years (approximately 0.8). One can see the relationship between the two stocks over the last 200 days in the below chart. As you can see, there has been a diversion in the performance of Visa from that of Mastercard. If one is to believe the theory of mean reversion, a correction is more than likely. Hence, this appears to be a good pair trade to enter. In this example, we will go short the spread.
In order to shield the investor from any volatility in the industry or stock market in general, a dollar neutral trade would need to be entered. Given that Visa is currently trading at 80.13 and Mastercard trades at 105.73, the investor would need to buy 1.3 Visa shares for each Mastercard share.
Let’s assume we go short 100 shares of Mastercard and long 130 shares of Visa. This means that the investor has now entered a dollar neutral trade and will only be exposed to movements in the spread between the two shares.
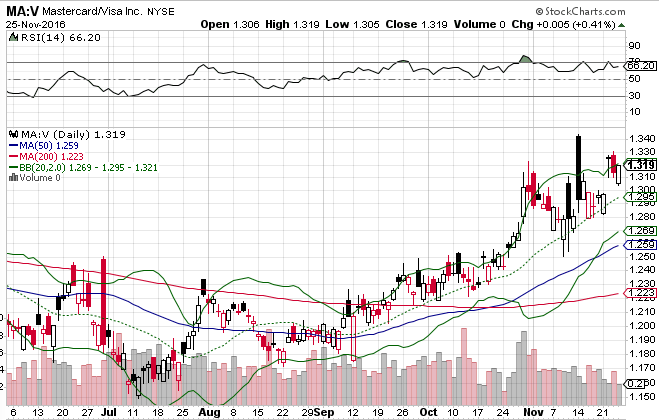
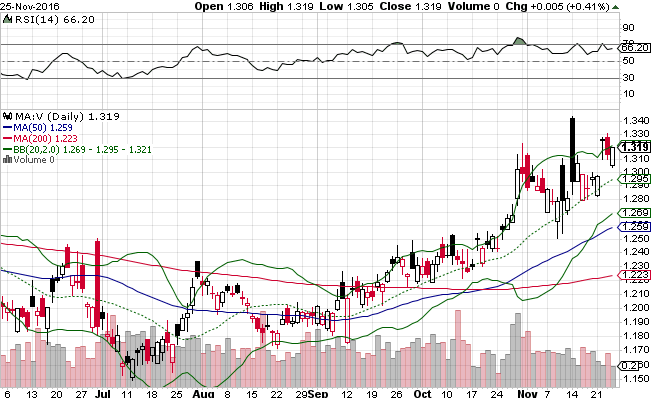
The below chart is the ratio of Mastercard to Visa. As one can see, the ratio has been increasing lately and is at a yearly high. We can use all of the standard technical analysis tools to analyze the spread itself. Taking a look at the above chart, one can see that the ratio is now touching the edge of the Bollinger bands. We can also see that the RSI indicator is in the overbought level. Also note that the volume of the traded spread now appears to be decreasing. All of this points to a possible reversal of the trend and hence a fall in the spread.
Potential Risks of Pair Trading
The benefits of pairs trading is well evident, the chance to take opportunities from idiosyncratic movements in a stock without general market volatility.
However, there are some risks that are inherent with pairs trading. For example, there is the chance that a divergence could last for a much longer time than originally estimated. There is also a risk that the relationship itself could break down entirely and never revert. Moreover, spread trading goes against the ideas behind traditional trend trading, namely that one buys the stock that is performing well and sells the stock that is underperforming.
However, as with the trading of single stocks and other assets, the risk has to be carefully analysed and adequate research must be done to determine the strength of the correlation.
Conclusion
When it comes to trading, none has been quite as well tested as that of spread trading. There is a reason that this was one of the most profitable strategies employed by Julian Robertson at the Tiger Fund in the 1990s. Assuming a trader picks the stocks that have the best historical correlation with spreads that were predictable, profitable trend trading is possible.

