

Just last week, we stunningly nailed the bearish analysis on PANW. That was a short term trade. After that article, I have 3 requests for longer term trades on guess which stock…KMB?
[You might have already guessed due to the headline of the article, but hey, congrats for paying attention.
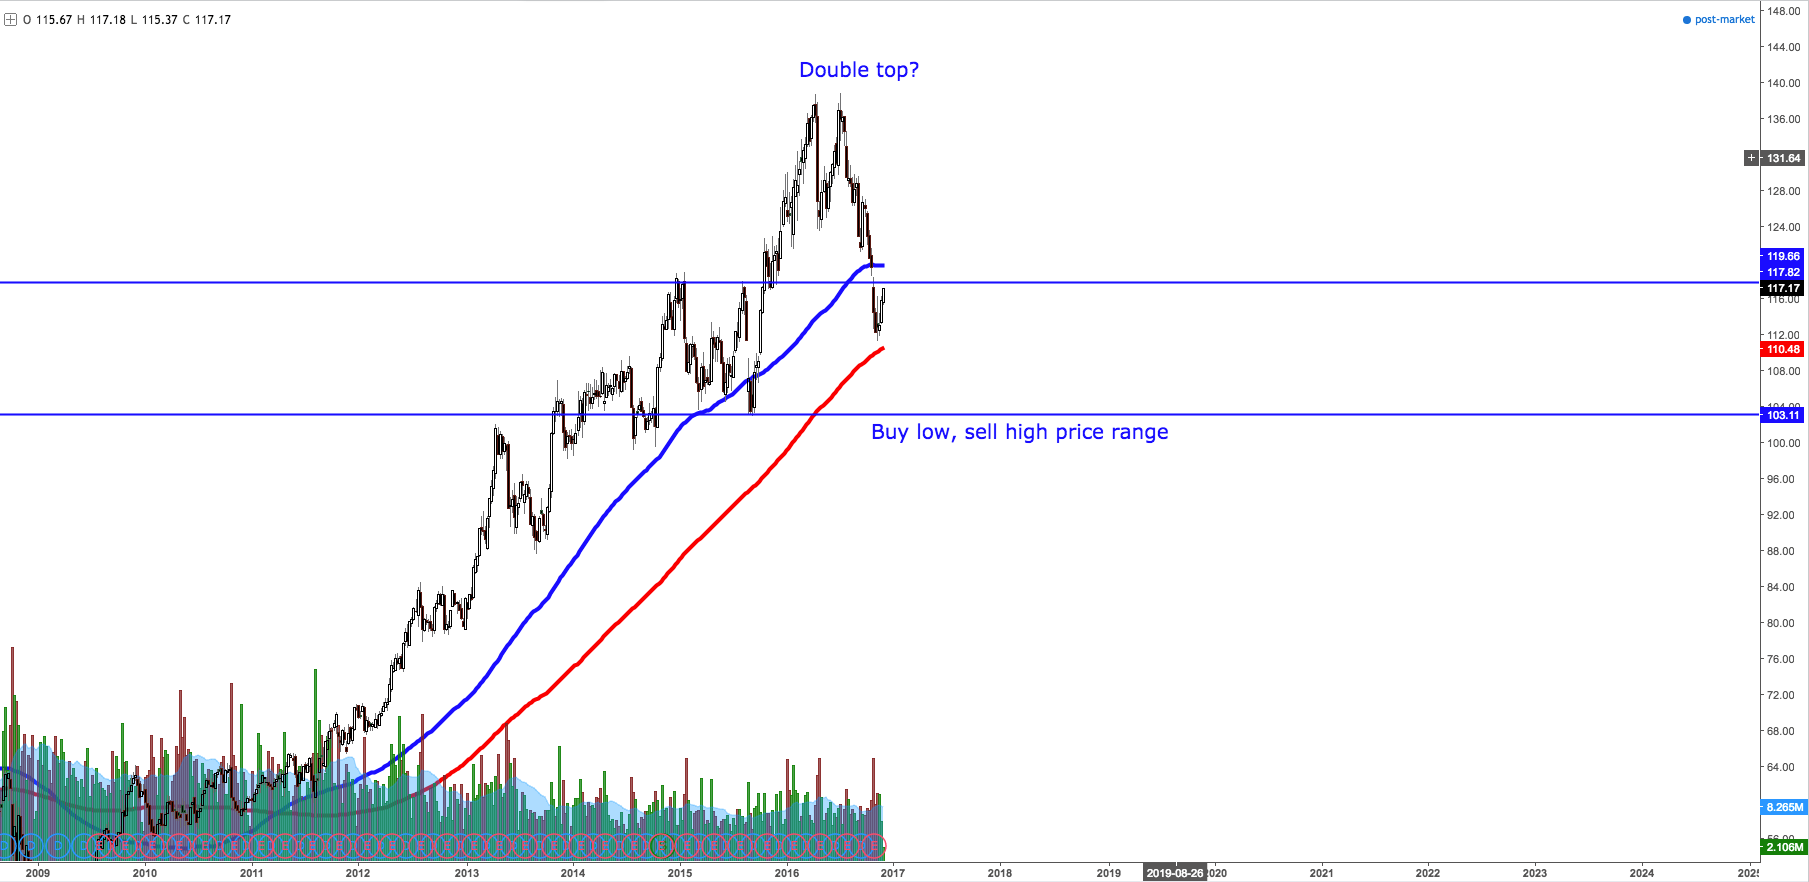
I personally find KMB to be in a very peculiar spot right now. You’ll notice the blue line is the 100 simple moving average on a weekly chart. At $119.96, that price will serve as a very strong resistance along with the price of $117.82. I’ll likely be keeping my eye on a short or potential bear call spread at that location sometime next week.
I’ve seen some good arguments calling KMB a double top on the weekly. That too makes sense and because KMB did already have a nice 15% pull back from its July highs, that could be all the down side action this bullish stock gets.
On the other hand, after a monstrous run of more than 100% since 2010, I would like a pull back in the next 2-3 months down to the $103.11 area for a good ‘buy low, sell high / long term dividend’ type of play. You’ll notice KMB almost bounced off of the 200 SMA as well on the weekly chart. That too would be a solid buying spot if Kimberly can resist that price of around $110 in the next few weeks (forming potentially a double bottom).
Therefore, the play on KMB right now is bearish to neutral, waiting a bit longer before any real buying signals come in. I don’t see anything marvelous on this stock short term. Interested to see what happens with it from here. OF course, if you have any questions on KMB, feel free to let me know below or email me anytime. Jerremy@reallifetrading.com

