

The recent price action in soybeans has the potential for the setup of a great trade. The tepid seasonal rally off the September lows speaks volumes. Price is not showing any significant strength, it merely seems to be retracing the large break off the June 2016 highs. By looking at fundamental and technical factors, a good case for lower prices can be made.
One of the big impetus to the recent rally has been the voracious import appetite for soybeans from China. They seemed to have been front loading their standard purchases of the US 2016 crop. Apparently they have purchased between 75% and 85% of their expected 2016-2017 imports from the US. That is well ahead of their seasonal standards. What are thy thinking you might ask? It is of my opinion that the Chinese are front loading purchases due to their concerns about trade relations with the new Trump administration.
There are several other supply issues that also must be factored in. First, the USDA estimate of a 440 mil/bu carryover for the 2016-2017 season is double the highest of any in at least ten years. Next, the end of El Nino event is looking to improve soybean crops in south Asia (especially India). And while the beginning of La Nina has the potential to disrupt South American production, current crop conditions are ideal. On top of that, the low value of the Brazilian Real makes their price lower than the costs of ours.
Furthermore, with Brazilian and Argentinian supplies of early soybeans hitting the market in mid-February, it really looks like there is little upside from more world import demand for US soybeans. Currently there is more than an abundant supply of beans globally. That overhang looks to increase, as South American production looks plentiful (for now).
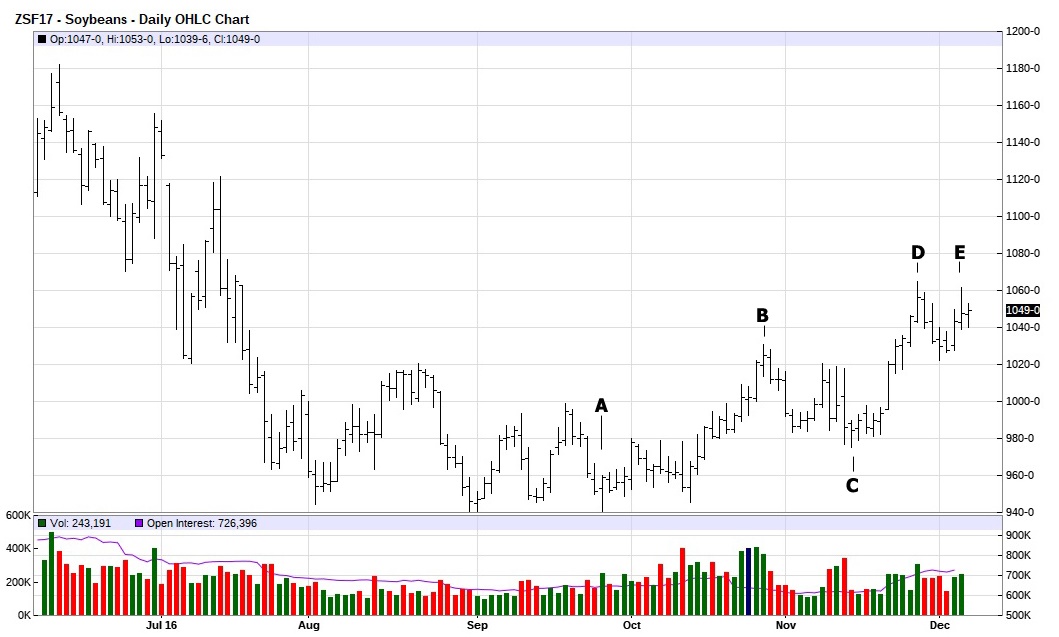
Technically, there are a few chart patterns that also need to be considered. First is what I like to call a http://becomeatrader.net/swing-double/ (link).The move from the low on September 27th at $9.40 ½ (A) to the high of $10.31 on October 27th (B) was $0.90 ½. If you add that to the low on November 14th of $9.75 ½ (C), a doubling of that move would be $10.66. The actual high on November 28th (D) was $10.65. This would be an ideal place for a significant high to occur. Also note the lower average volume between the wave from A to B and C to D. The drop suggests the second wave has less underlying momentum than the first. A classic example of divergence and fading enthusiasm. Also note the potential double top at D & E.

A second chart pattern that supports the idea that soybean prices are about to reverse is the Fibonacci retracement from the June 10th high of $11.82 (A) to the low on September 27 at $9.40 ½ (B). The subsequent rally to the high on November 28th at $10.66 (C) is just 1 ½ cents past of the 50% retracement of $10.64 ½ ($11.82 – $9.34 = $2.48) ($2.48 / 2 = $1.24) ($9.40 ½ +
$1.24 = $10.64 ½).
The confluence of technical indicators and fundamentals paint a pretty strong picture of why to be bearish on soybeans. The one thing I don’t like about the trade is that the setup looks so good. In the market, like everything in life, if it looks too good to be true, it usually is. Still I’m going to take the trade. It would be more emotionally painful to not take it and have it go the way I expected, than to have it go wrong and lose money.
I’m following the Bennet Goodsped adage: “This is to all those who have the guts to follow their gut.”
For more winning technical analysis, Check out Paul’s book “To Be a Trader” highlighted on his website

