

Thirty-year Treasury Bond futures have fallen by more than 15% since the mid-July high. Thursday’s “not calling it a taper”, taper announcement by the ECB, in which they plan to reduce the rate of their monthly ECB Bond purchases from 80 billion to 60 billion per month, was initially shrugged off and the U.S. interest rate sector managed to defend its low set at the beginning of this month. However, Friday’s action once again saw Bond prices driven lower as yields moved higher. We think the low price/high yield point for this decline is rapidly approaching. Furthermore, based on the Commitments of Traders report, there’s a strong case to justify placing new money on the buy side of the interest rate sector.
We typically look at short-term, daily charts. The scope of this situation requires a step back to a weekly resolution to place the current market imbalance in the proper context. We’ve color coded the subgraphs in the included chart below to illustrate the opposing nature of the commercial and speculative actions within a given market. The first subgraph represents the net position of the speculative and commercial traders. Obviously, the larger the absolute value of the number, the more bullish or, bearish a particular trading group is at that moment in time. As illustrated, the commercial traders now hold their largest net position since February of 2013. The second sub graph is our creation. It represents a combination of net and total position data to create what we call the “COT Ratio.” The COT Ratio helps account for a given market’s bias as well as commercial trader total capacity issues. The important point to remember for the current situation is that the speculative traders have more Dollars committed to the short side of the 30-year Treasury Bonds than they have since since February of 2013.
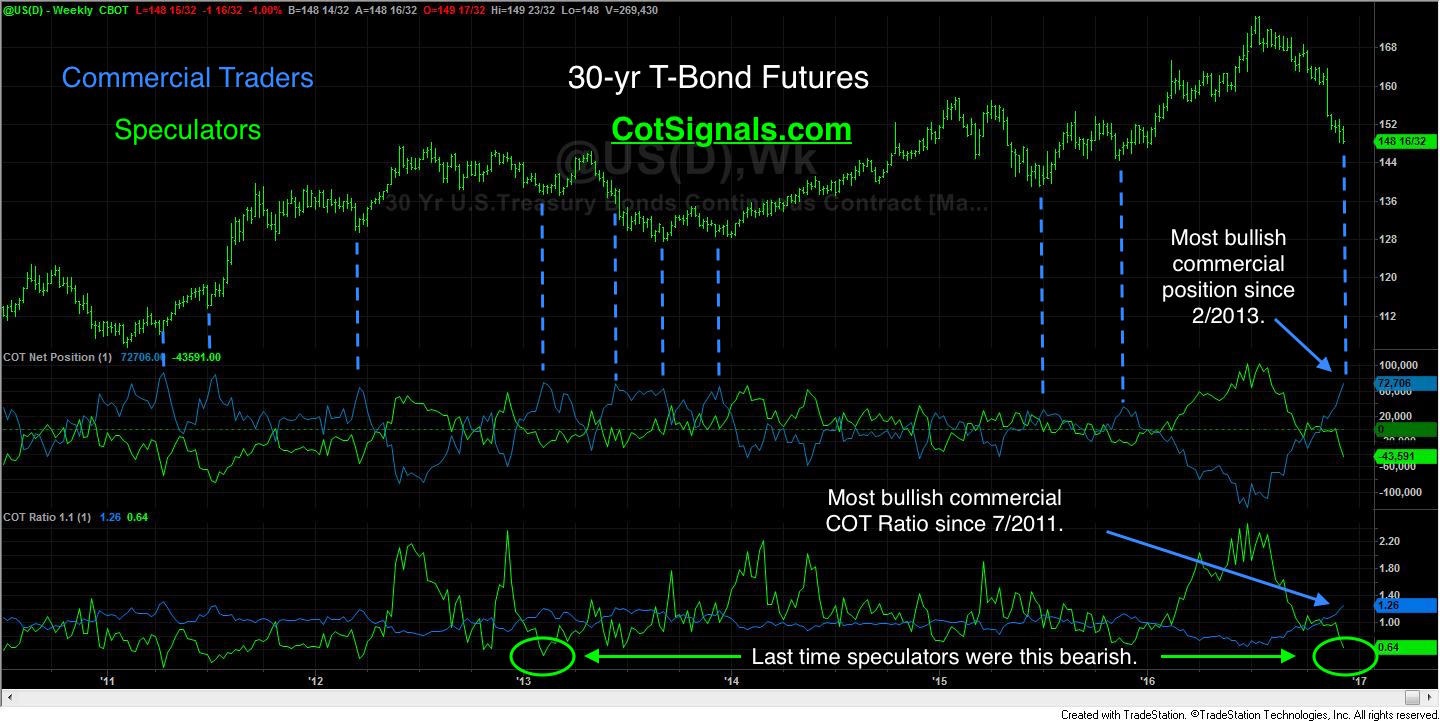
Taking a step back to put the pieces together, notice that the commercial traders were net sellers from this spring through summer. Conversely, the large, net long speculative position that had built up this summer has been completely reversed over the second half of this year. Furthermore, note that the biggest speculative position on the chart came at the market’s dead high. This speculatively fueled push higher is similar in style to the previous peaks. Specifically, notice that commercial buying via the dashed blue lines corresponds directly to the speculative selling troughs. This clear illustration of commercial support on market declines is an easy way to see the interaction between the commercial and speculative traders.
It certainly looks like speculators viewed Mario Draghi’s decision as additional gravity adding to the market’s significant decline. We feel that the uptick in speculative selling only adds to the argument favoring a short-term bottom and a solid, speculatively fueled short-covering rally as they run out of bullets in the face of an increasingly bullish commercial trading group. Commercial traders are value-based traders, and they clearly feel that the 15% decline they’ve captured since this summer is a gift horse. Their recent purchases even indicate a shift towards outright bullishness below 150 in the March 30-year Treasury Bond futures.
Please visit CotSignals.com for more information on our Commitment of Traders analysis and nightly trade recommendations.

