

We consider ourselves short-term traders; rarely holding a position for more than two weeks. Our trades normally reflect this. However, there’s a setup in the crude oil futures market that deserves a look at the bigger picture…and it bodes poorly for energy bulls.
We’ve plotted the weekly crude oil chart back to the July ‘08 all-time high. This serves two purposes. First, it allows us to calculate the Fibonacci retracement levels from the all-time high through this year’s low. We’ve also calculated the Fibonacci retracement levels from the 2014 high through the current low. Secondly, it provides context for the shift in crude oil producer behavior within the crude oil futures market as U.S. shale production ramped up.
The context of the crude oil producers’ actions is imperative to understanding where we are within the current rally, especially since OPEC has finally generated some degree of cooperation among its members. The rapid increase in petroleum fracking as noted in the Energy Information Agency’s inset chart has forced the commercial crude oil producers permanently into the sell side of the market. Historically, crude oil refiners’ purchases kept the total commercial position more evenly distributed.
Looking at the chart’s current setup we see a couple of the most important points. First, the market is technically very near the significant breakout level of $56.27, the June high. Interestingly, this comes in very near the first Fibonacci retracement level from the June ’14 high through the lows, now at 55.78. Also, note just how far away we are from any of the Fibonacci the all-time levels. There are clearly some vacuums above this market.
However, we think any near-term vacuum higher is a selling opportunity. The chart below shows that the recent rally has been speculatively led. This is bad news for bulls as the net long speculative position approaches its highest reading since June of 2014. The market fell by nearly half in the next six months. The speculators are rarely correct.
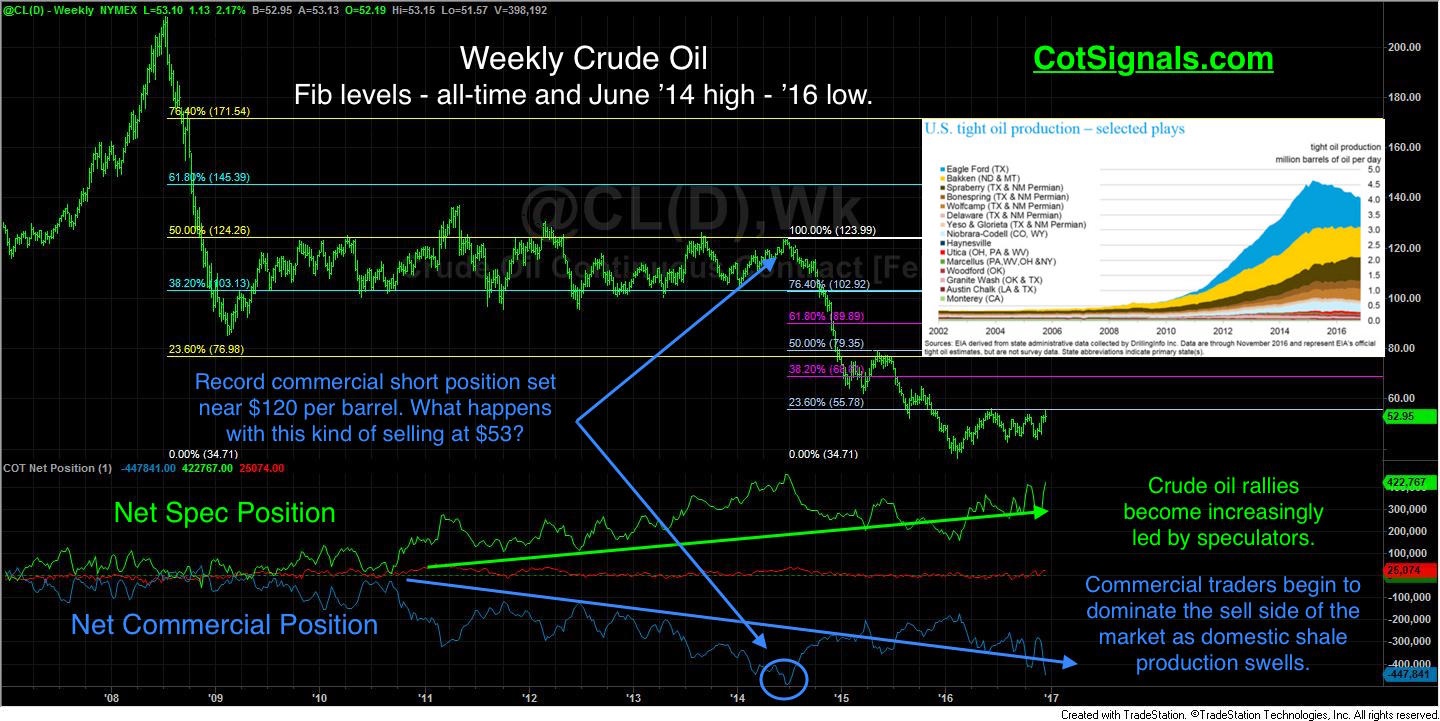
The current position extremes between the bullish speculators and the bearish commercial traders haven’t been this wide since June of 2014. Furthermore, the spread between these two groups has never accelerated faster in any three-week period. Given the successful track record of the commercial traders in the crude oil market, we’ll place our bets increasingly on the short side as the market attempts to push through overhead resistance. Structurally speaking, the price range should remain just below the profitable fracking estimates as OPEC attempts to recapture market share and refill their coffers.

