

The feeding frenzy that followed the election of Donald Trump as the next president of the USA has been frantic. The major indices made new all-time highs, and the Dow came within a whisker of 20,000 intraday. The index we watch, the S&P500 large caps, was up about 130 points post-election when it closed Friday.
That skyrocket was fueled by a yuge rotation out of Bonds and fixed-interest securities and into stocks. According to the Bank of America, inflows to equities totaled about $21 billion (with the bulk of it going into ETFs at the expense of mutual funds and actively managed funds) last week – the ninth largest week – while about $4.4 billion flowed out of bonds. Money has been moving out of fixed interest investments for seven straight weeks. In contrast, BofA estimates inflows into equites at $63 billion since the election.
But nothing in the market lasts forever and every rally eventually runs out gas. Last week we saw some preliminary indications that the Trump Trade is nearing that point.
The S&P has already reached our first target around 2275, and pulled back. That is normal behavior; rallies always slow and consolidation as traders start worrying about guaranteeing the paper profits they have already made and start wondering about how much further it can go.
That’s about where we are in the SPX now. Last week we made another all-time high at 2273, and then pulled back into a consolidation range with lower highs and higher lows, a technical pattern usually described as a pennant. It indicates at least a pause in the rally.
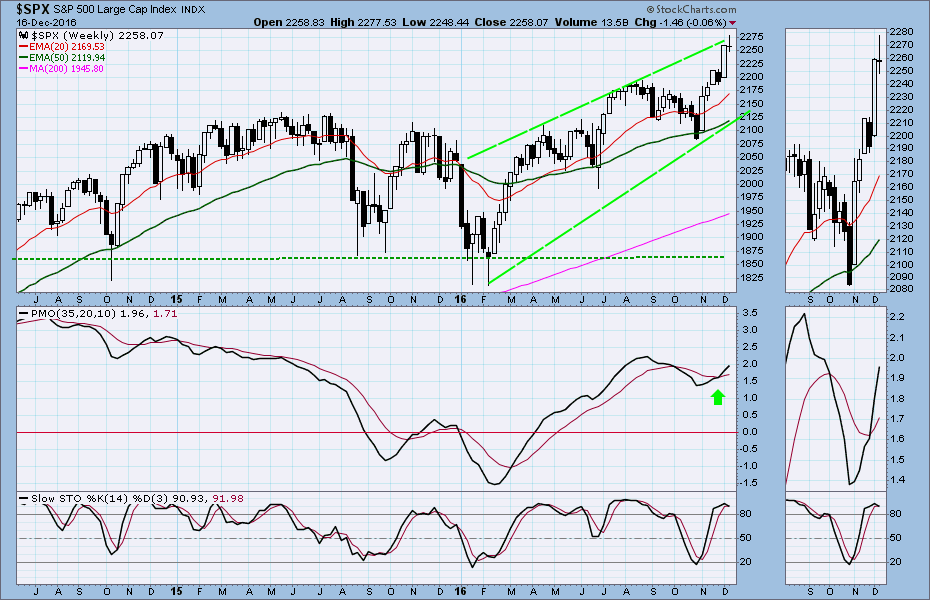
On the longer time-frame, the weekly chart, the index closed the week almost exactly where it began, a technical pattern called a ‘doji.’ The pattern looks like a child’s spinning top (see the weekly chart below) and it is a sign of indecision. Traders are starting to think about heading for the exit.
All this in a market that is extremely overbought in the short-term, and in which the momentum and internal strength indicators are weakening.
Normally there is a “Santa rally” in the SPX that carries the market higher into the end of the year. This is no accident; there are platoons of market pros whose annual bonuses are determined by the closing price on December 31.
We’re not sure that’s going to happen this year. The Trump Rally may have already sucked all the loose money back into the market, and when everybody is all in, there’s not much more room for expansion.
We’re not expecting a big plunge. The long-term uptrend is still intact, and the most likely scenario we see is a retracement first, followed by a bounce.
When everybody is doing the same thing most of them are wrong. We usually sell short-term options on the SPX (and the S&P mini-futures) and most of the time the options we sell expire out-of-the-money.
But for the rest of the year we are not selling Puts, which would require us to pay out of the market plunges. We don’t think it will. But there is enough downside risk to scare us away from a trade that is normally profitable. Just in case.
Last week:
The S&P 500 cash index ($SPX) closed at 2258.07 last Friday, down 1.52 points for tiny weekly loss, ending the week essentially where it began.
The Fed interest rate increase, announced on Wednesday afternoon, became a convenient excuse for a retracement that had been brewing all week. The “Trump rally” had been running out of steam and the Fed provided a reason to pause. The very short time-frame remains overbought, but the market is holding above the important support around 2250 and closed above it.
This week:
We may see a retracement in the first couple of days this, followed by a Christmas rally into the holiday. The seasonal bias is favorable this week. We could also see a continuation of last week’s consolidation range, with the market remaining inside the 2275-2245 channel.
However the index needs to hold above 2240, especially on a closing basis. A close below that price could be the precursor of a larger move down. The short-term is overbought, and a larger retracement, followed by a bounce, is possible, if not this week then soon.
Today
We us the S&P500 mini-futures (currently EZH7) to trade the S&P.
The Electoral College votes today and the presidential election may finally be over.
Today 2258.50-56.50 will be a key zone. A failure to move above it could lead ES to repeat Friday’s range first before it determines the next price direction. Technical indicators show the upside is limited. 2275-85 will be first resistance zone for today if ES moves above the key zone. Due to the holiday season, selling still should be minor.
A move below last week’s low 2243 could push price toward the 2235-25 zone. However the 20-day moving average line at 2220 level should hold ES up.
Major support levels: 2213.50-12.50, 2201-2199.50, 2193.50-95.50, 2183-81
Major resistance levels: 2268-72.50, 2279-83.50, 2288.50-93.50, 2300.50-05.50
This is our last article for 2016. Have a happy holiday and we’ll see you in the New Year.
Our annual half-price sale starts January 1. Go to www.naturus.com and subscribe to get the details. We only do this once a year and it doesn’t last long, so do it now.

