

Investors have a tendency to assume traditional market correlations are constant and reliable, but the reality is they are dynamic and unpredictable. One should never make an investing decision based on traditions of market correlations, instead, it is important to verify what you think you know before acting. For instance, those supposing higher stocks were only possible when Treasuries were on the decline likely didn’t fare well in recent years because in a QE world both stocks and bonds traveled higher together. Let’s take a look at a few important correlations that might be misinterpreted by the mainstream investment community.
S&P 500 vs. Currencies
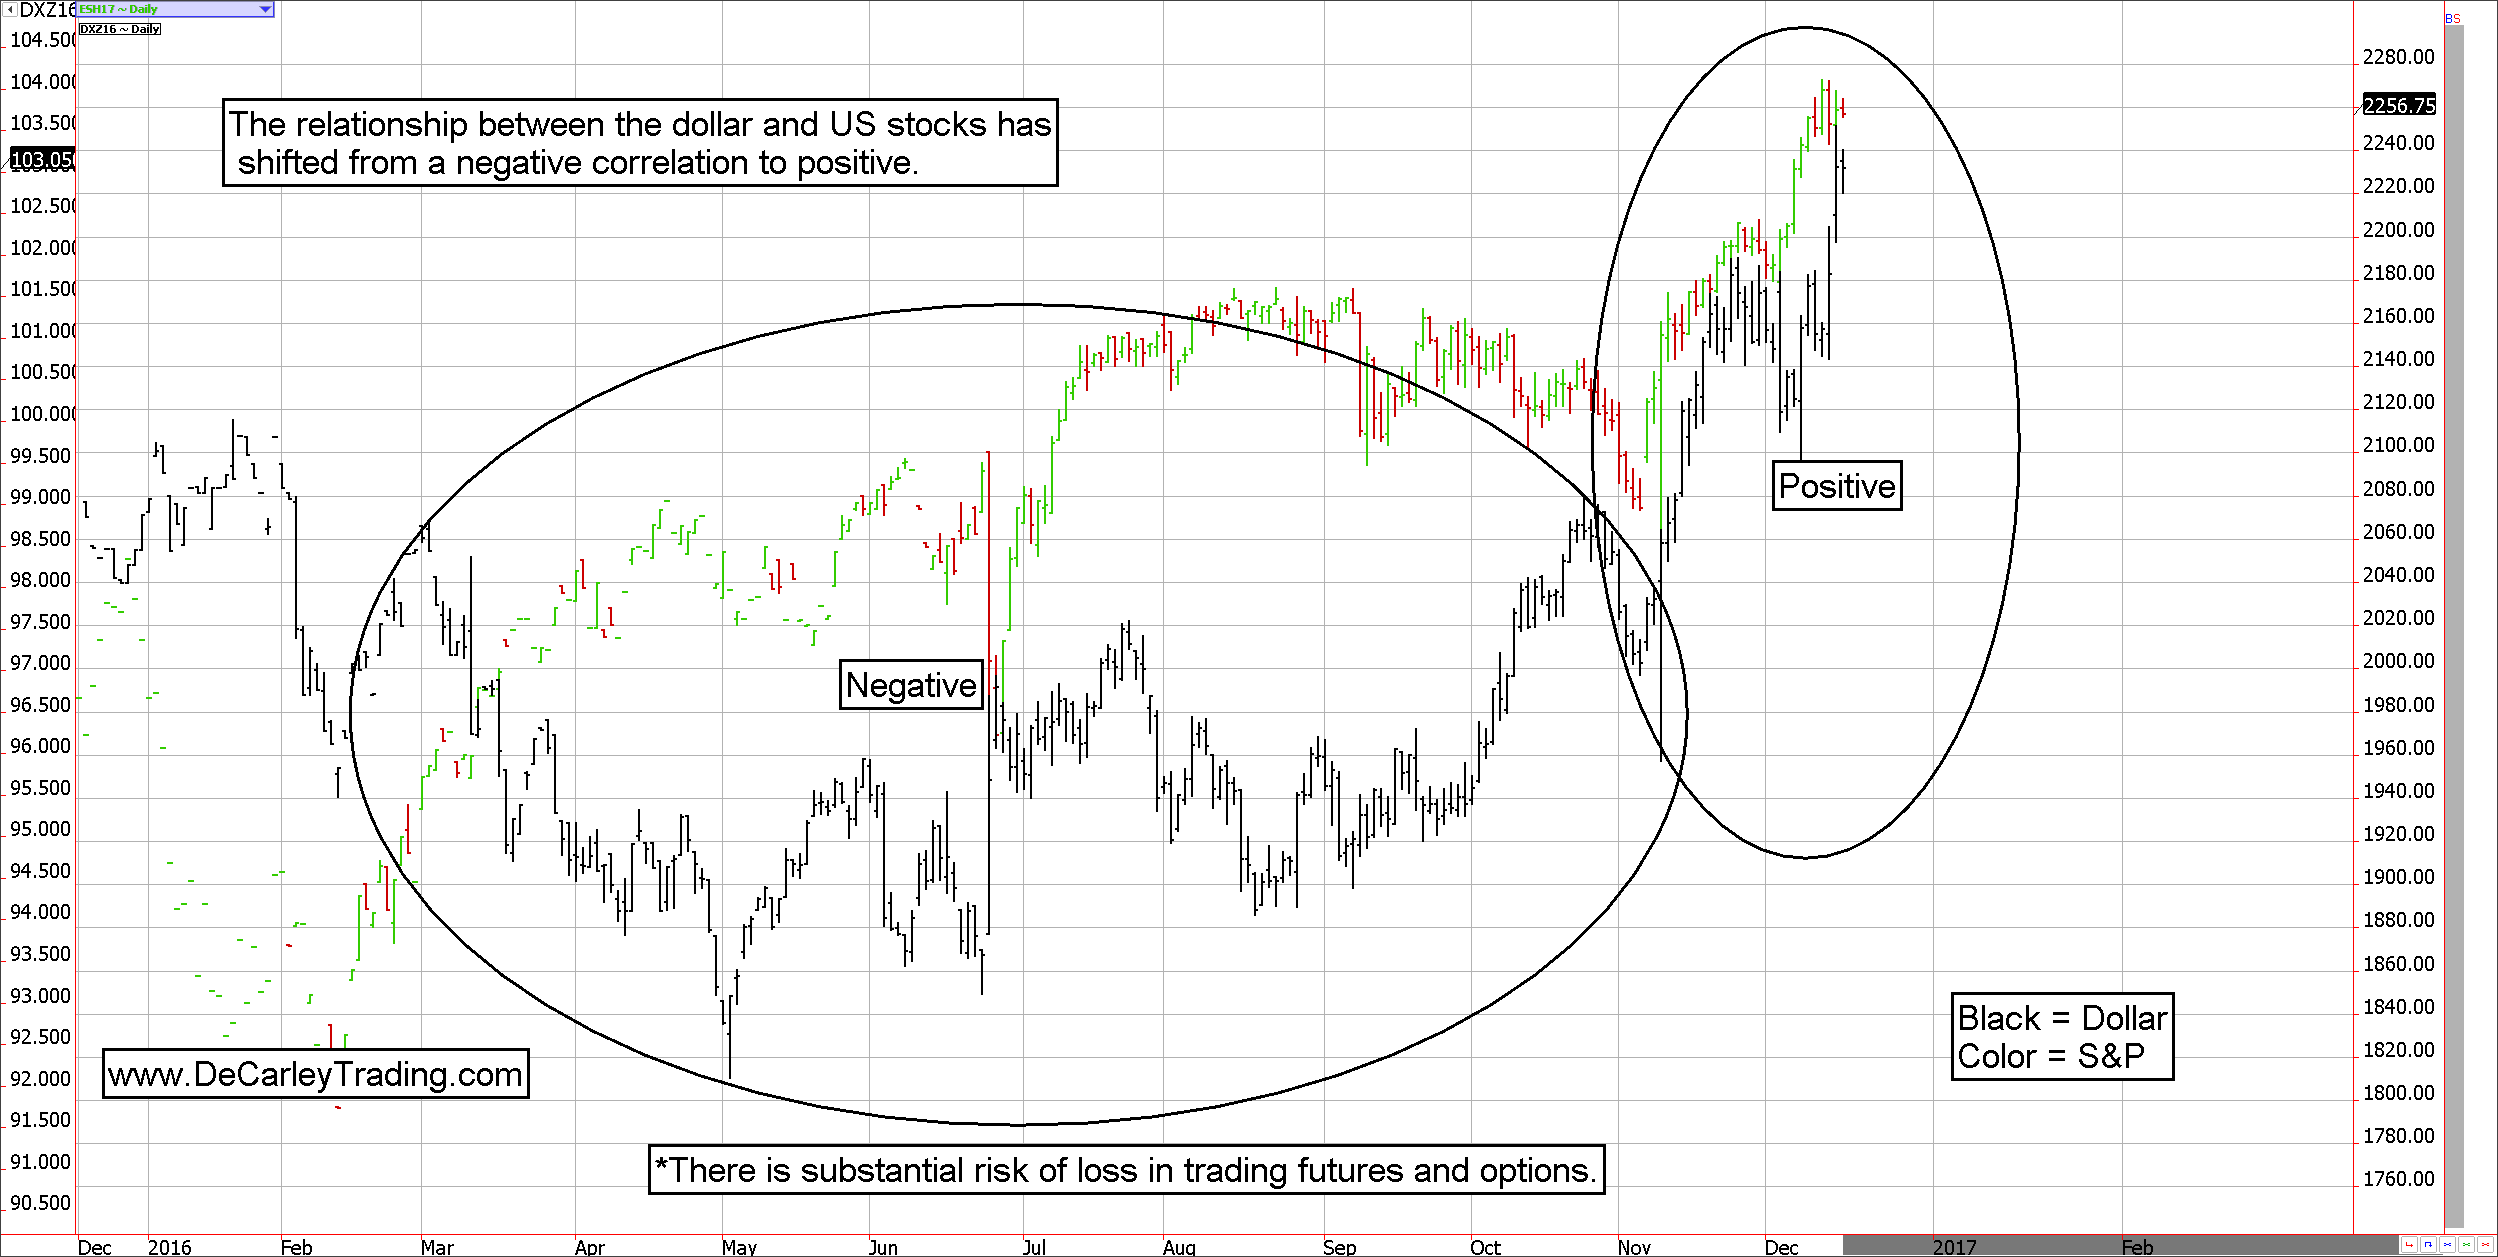
The assumption held by most retail traders is that a stronger US dollar is bad news for domestic equities. In theory, a higher greenback makes it more difficult for US-based companies to compete overseas and it deters them from repatriating funds; thus the exchange rate often has a direct impact on earnings potential. In mid-to-early 2016, as the equity markets were struggling CEOs were blaming weak earnings on a stronger dollar. Naturally, investors bought into the story and have presumed a negative correlation since. Yet, what we are seeing in the market is the exact opposite.
The dollar and the equity markets have rallied together. Not only that, but the dollar has reached a new 14-year high at a time in which the S&P 500 is at an all-time high! Clearly, the negative correlation between these two asset classes has shifted. According to stats compiled over the previous 180 trading days, the correlation is now a positive 66 to 70%. If stocks go into a corrective phase, we will once again hear CEOs blame weakness on the stronger dollar, but the reality is it is possible for both markets to thrive simultaneously. Accordingly, if you find yourself wanting to sell stocks because of action in the currency market think again. However, if you want to sell stocks because the market is irrationally lofty, that might make more sense as a rational.
S&P 500 vs. Crude oil
Who could forget the energy market fiasco that took place in early 2016? Freefalling crude oil prices triggered panic in the high yield debt market (junk bonds) which are largely tied to cash-strapped energy companies. The result was mass selling in the equity markets as investors braced for the next shoe to drop on the financial crisis. In addition to junk bond market concerns, lower oil prices are associated with lower global growth because if expansion was swift, demand for energy would support crude oil prices.
Not surprisingly, during this time the correlation between stocks and crude oil was highly positively correlated. I don’t recall the exact correlation coefficient but if my memory serves, it was close to 90%. In summary, each day oil prices settled lower would see a 9 out of 10 chance the S&P would follow suit.
Fast forward to today and that correlation is non-existent. In fact, the correlation stats run over the previous 180 trading days (roughly nine months) is currently resting at a positive 9% (that isn’t a typo). Crude oil and the S&P 500 (specifically the e-mini S&P futures contract) close in the same direction a mere 9% of the time. Statisticians will tell you this suggests little-to-no correlation at all. Thus, if you find yourself wanting to buy or sell stocks based on what crude oil prices are doing, don’t. There are more useful predictive tools. With that said, if oil falls back into a death spiral, the correlation will return so be on your toes!
S&P 500 vs. Treasuries
As mentioned in the opening paragraph, stocks and bonds have managed to rally in unison overall for several years as the financial markets digest the Quantitative Easing stimulus program. However, now that we’ve (seemingly) gotten past the need for such aggressive government market manipulation we might finally see the stock and bond market fall back into a more traditional relationship of negative correlation. At the moment, there is a roughly 60% to 70% negative correlation between the e-mini S&P 500 futures contract and the Treasuries (30-year bond and 10-year note). Accordingly, basing decisions based on the negative relationship between these two markets is logical for the time being.
S&P 500 vs. Copper
For as long as I can remember, copper prices have been considered a sort of bellwether for economic health. Increases in copper are interpreted as a sign of increased demand on the heels of growth and declines in copper signal an economic downturn. For the most part, the positively correlated relationship between stocks and copper is accurate in real-time. According to the stats available to us, copper and the e-mini S&P 500 futures have settled in the same direction about 60% of the time over the previous 180 trading days.
In conclusion
Investors should be aware of current market correlations as opposed to making assumptions on what they might be based on conventional wisdom. Correlations are helpful to guide trading, but they are not consistent. Thus, traders should be keeping their eyes open to changes in the landscape and behaving accordingly.
*There is a substantial risk of loss in trading commodity futures, options, ETFs. Seasonal tendencies are already priced into market values.

