
When it comes to Forex trading and technical analysis, one of the most well known tools is that of the Fibonacci retracement. The Fibonacci retracement relies on particular metrics which give an indication of support and resistance levels. These are the key Fibonacci levels of 23.6%, 38.2%, 50%, 61.8% and 100%.
Although Fibonacci levels have proven themselves in stock and Forex investing, it would be interesting to see how a Binary Options trader can make use of them in order to profit. Due to the payoff structure of Binary Options, they may be well suited to trading around these levels.
Quick overview of the Fibonacci
The Fibonacci sequence is a mathematical formula where Fn=Fn-1+Fn-2 where n is the number of the sequence. This series determines a number of important relationships with the prime of them being the Golden Ratio. The Golden Ratio is n/(n-1) and is 1.618. This is an essential ratio in many disciplines and the inverse, 0.618 is particularly important for financial trading. As you can probably tell, this is one of the key retracement levels given above.
The 0.61 level is the place at which a trader should buy a stock when it is on a pullback from an uptrend. This is based on the theory that it is the level at which fear peaks and bargain hunters start to look for opportunities to buy at depressed levels. Apart from providing the trader with a rough indication of support and resistance levels, the retracement levels can also help a trader confirm a new trend.
Taking a look at a downtrend, once the stock has breached the 0.618 level, traders will usually take this as an indication that the stock will continue falling as all buyers have been exhausted.
Trading Binary Options
Given that the investor knows the maximum he will lose on a trade, using Binary Options will allow the trader some certainty around any potential outcomes. Utilizing CALL and PUT options, the trader can profit from retracements on uptrends and using a PUT option will allow the investor to gain from a confirmation of a downtrend.
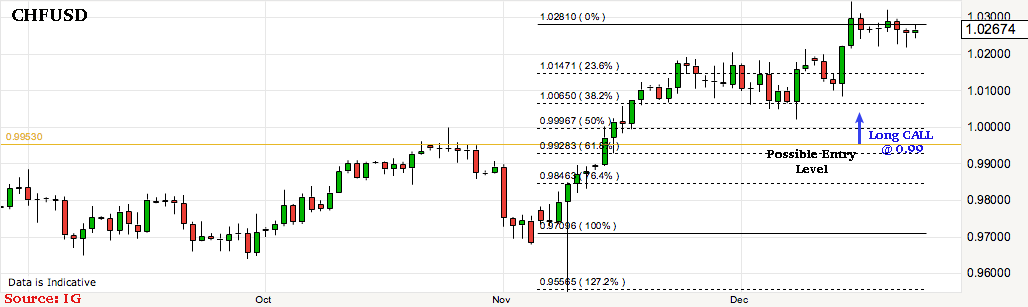
Taking a look at the below chart of USD/CHF, we can see that the dollar has being depreciating considerably over the past 2 months. We can see the 0.618 Fibonacci level at 0.99. We can also see that this level was a previous resistance level prior to November. If the Swiss Frank were to start depreciating, a key level to watch would be 0.99. According to theory, this would be the level at which the investor would go long a CALL option. The investor would place a limit order for a CALL option at the 0.99 level.
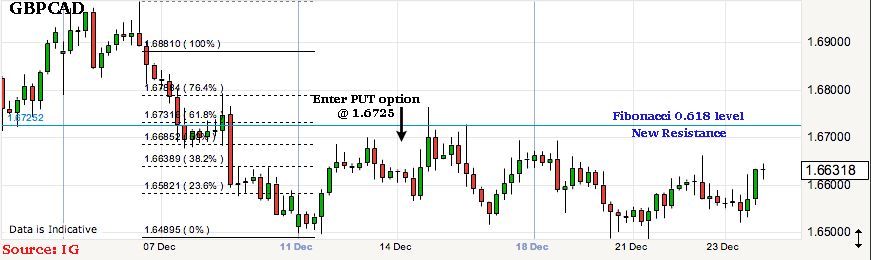
Taking a look at a scenario with a downtrend, the below graph is the GBP/CAD cross. As we can see, in early December Sterling began to depreciate quite substantially. It fell below the 0.618 Fibonacci level of 1.672. This would have been an ideal time for an investor to purchase a PUT option on the pair. As GBP kept on weakening, the previous 1.672 Fibonacci level became the new resistance level. GBP/CAD would not breach this level over the rest of December.
Fibonacci Variants
Although Fibonacci retracement is the most common way a trader can make use of the Fibonacci sequence, there are many other strategies that can be used with a combination of different options. One of these is the Fibonacci Channel. This is a simple variant where Fibonacci levels are drawn diagonally. In this way, the trader is able to take a view of the range the asset will be trading in over the period of time.
This is the ideal tool to use should you want to use Binary Option “Tunnels”. These options allow the investor to take a view on the particular range the asset is likely to trade in over the option expiry time.
Another well-known Fibonacci variant is a Fan formation. In order to create a fan, one draws a primary trend line usually from the highs and lows of the series. Once this has been drawn, the line is divided by the vertical distance between these points with the Fibonacci ratio of 38.2%, 50% and 61.8%. This then allows a trader to take a view on support and resistance levels on a trending series.
Although the Fibonacci sequence is an effective technical tool, you have to combine it with traditional support, resistance, trend and pattern analysis.

