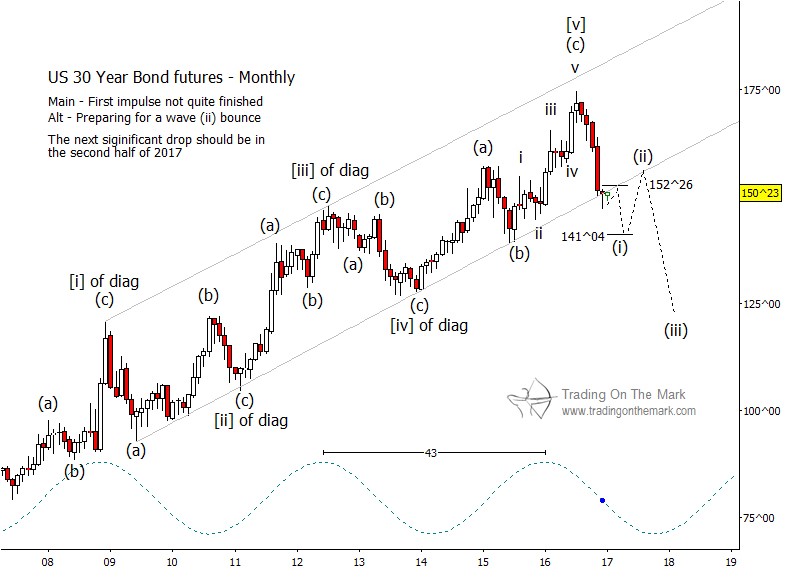
Treasury bonds have been following our script very well for several years now. Even so, they’re in new territory now — what is probably a bear market for bonds. There should be lots of trading opportunities going forward, but they might be a little harder to find than they were when the big upward diagonal pattern was in effect.
Looking at the monthly chart for 30-year bond futures, note that price has poked slightly beneath the channel that has supported the bounces in treasuries since 2009. Next, it would be normal to see a retest of the broken support before the decline resumes.
At the same time, the decline from last year’s high currently appears to consist of three waves, but we are expecting it to develop later into a five-wave structure. If we see a small rally near the present area to test the former support (now resistance), that might be considered the fourth wave in the sequence of five. Another decline would complete the structure.
A retest of the channel boundary and Fibonacci-related resistance coincide near 152^26, making it the most attractive area for the decline to resume. Later this year, price should reach for a new low. The area near 141^04 is a potential target, but it is not a requirement that price must decline that far.

Note that the dominant 43-month price cycle predicts a low late in 2017 or early in 2018. This suggests the possibility that the larger-scale Elliott wave structure will finish the current phase of the decline soon as wave (i) of an impulsive sequence. We might then see an upward-corrective wave (ii) that lasts a few months, followed by a powerful downward wave (iii). At this point the timing is speculative, but we have drawn the path on the chart as described here.
Note that the dominant 43-month price cycle predicts a low late in 2017 or early in 2018. This suggests the possibility that the larger-scale Elliott wave structure will finish the current phase of the decline soon as wave (i) of an impulsive sequence. We might then see an upward-corrective wave (ii) that lasts a few months, followed by a powerful downward wave (iii). At this point the timing is speculative, but we have drawn the path on the chart as described here.
Trading On The Mark has a lot more resources available to help you find the trades in 2017! Be among the first to see the opportunities when you receive our newsletter. You can request your copy via this link


