
There is always some uncertainty involved in crude oil market analysis, yet in the current environment, I would argue there is only uncertainty. We like to look utilize a handful of market analysis tools which generally include seasonal tendencies, the Commodity Futures Trading Commission’s (CFTC) Commitments of Traders Report (COT), and technical analysis. Each of these schools of thoughts are resulting in conflicting conclusions. Historical seasonal patterns suggest the path of least resistance during this time of year is higher (bullish). On the other hand, the COT Report warns of a potentially massive wave of speculator liquidation (bearish). Adding to the confusion, the price of crude oil as deemed by prominent chart analysis techniques is precisely neutral.
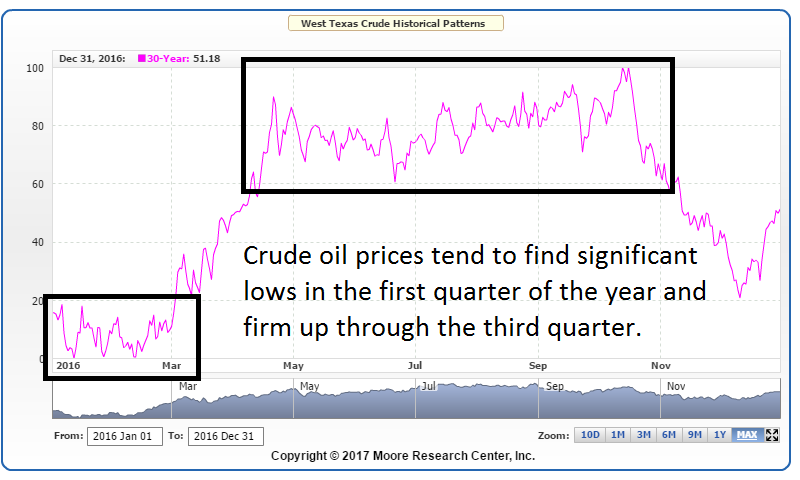
Crude oil seasonality
We all know that seasonal patterns aren’t the Holy Grail of trading but we also must recognize that price patterns that occur more often than not shouldn’t be ignored. One of the most reliable seasonal patterns over the years has been the strength of crude oil beginning in the latter part of the first quarter and extending through most of the third quarter. Again, this doesn’t mean that making money will be as easy as going long crude oil futures in January and selling in October, but it does mean that it might be a good idea to consider getting bullish on any large dip early in the year and getting bearish on any large rally later in the year. Despite positive seasonals that typically kick in next month, oil prices are on the pricey side. Thus, unless the market drops sharply in the coming weeks to enable entry at a discount, it would be difficult to trust the normal pattern.
CFTC’s COT Report
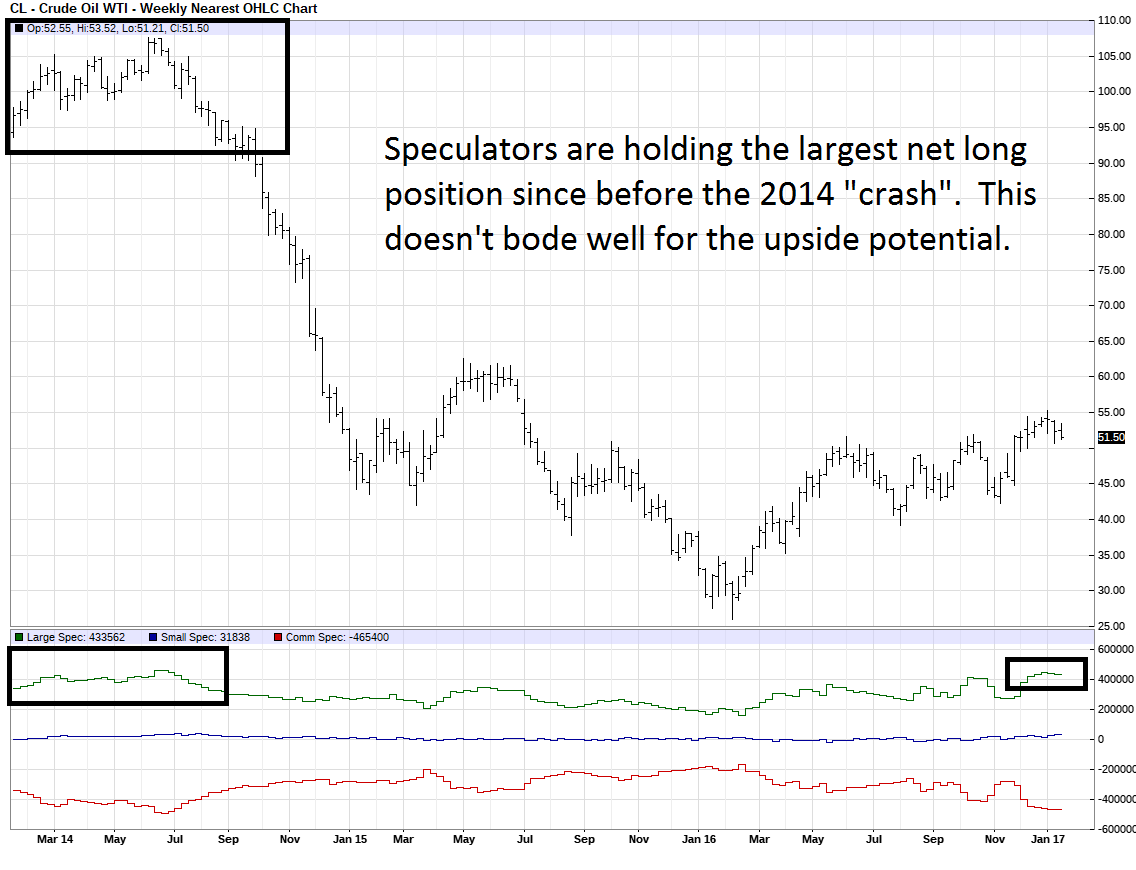
Our favorite tool for assessing market sentiment as well as identifying overheated trends is the CFTC’s COT Report. As a recap, when the COT Report suggests that speculators have amassed a relatively large net long, or net short, position it is generally a sign of a trend exhaustion. In simplicity, the idea is if “everyone” has already bought the market the buying will dry up due to a lack of available trading capital to enable the trend to continue. The same is true of a prolonged downtrend in which traders have expelled their capacity to sell additional futures contracts.
It might be hard to believe, but crude oil futures speculators are holding the largest net long position we’ve seen since oil crashed from just over $100 per barrel and eventually landing in the high $20s. In other words, the last time speculators were this aggressively long, the price of oil dropped roughly 60% in six months! This tells us that the upside could be limited for now. Further, it opens the door for mass liquidation should market participants be forced to digest some unexpected bearish news.
Technical Analysis
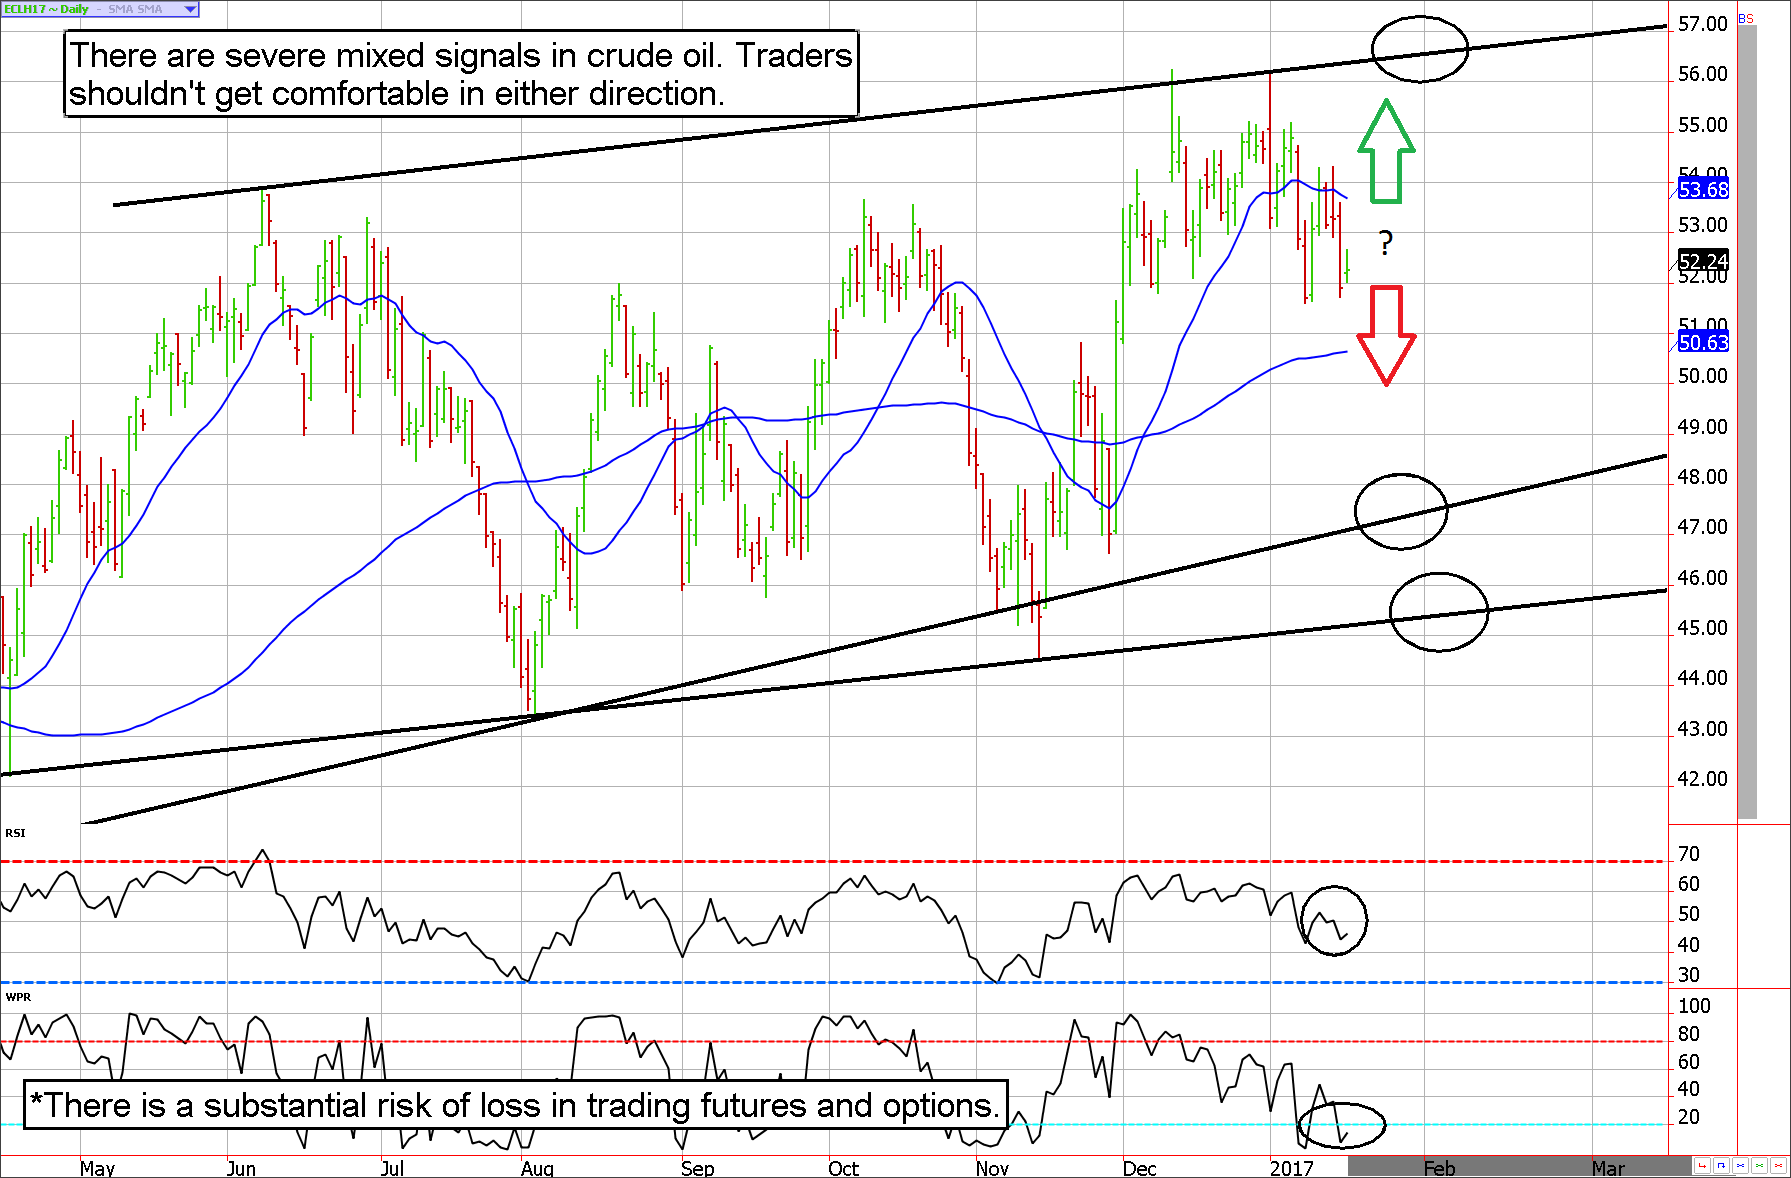
Unfortunately, the crude oil chart is equally as mixed. The Relative Strength Index (RSI) is mid-range without any hints at momentum and the price of crude oil futures are waffling within a trading range that dates back to the 2015 lows. In short, we cannot see any edge that would give directional traders anything more than a 50/50 proposition.
What to do about it
In light of the lack of clear direction in oil futures, the casual investor should probably take this as their queue to either stay away, lock in any profits that have been made on the way up (or down), and wait for the next move. Yet, aggressive speculators might be interested in buying option strangles. In short, this involves buying a call option and a put option in the same expiration month. Because more options than not expire worthless, it is generally a good idea to shop for low-priced options which also pose low risk to traders.
Specifically, we like the idea of going long the May crude oil 40 put and the 65 call. The total cost of the trade should run about $500 before considering transaction costs. This will represent the total risk of loss. While both $65 per barrel and $40 might seem like a long way away, we’ve seen moves of that magnitude several times in the last few years. Also, these options have just under 90 days to expiration. Even if the price of crude never reaches the strike prices it is possible that a volatile move in a particular direction will do the trick. For instance, the May $65 call traded as high as $750 a few weeks ago and the $40 put was upwards of $550 in mid-to-late-December. In theory, these options shouldn’t erode very quickly due to their lengthy time to expiration. This trade gives traders 3 months in the market with limited/low risk and a non-directional bias.
Futures, Options, Integrity
*There is a substantial risk of loss in trading commodity futures, options, ETFs. Seasonal tendencies are already priced into market values.

