

If you have been trading the decline in the British Pound, it may be time to take profits. We have been monitoring an expected five-wave structure down from the 2014 high in futures prices, and an important support level at 1.2120 appears to be holding. It probably represents the end of downward wave [iii] in the sequence.
This means that short-term traders might consider looking for opportunities to catch modest bounces that could be part of a fourth-wave correction. However, since fourth waves can take various forms and are notoriously choppy, it is probably best not to try for larger continuation moves upward.
Traders working on a higher time frame might consider watching for shorting opportunities near the middle of 2017, which is also the time when we believe the U.S. Dollar may resume its rally in earnest.
If you’re an active trader, this type of charting can be your guide to finding good entries and exits. New subscribers get a full month of access to all the services we offer, including our Daily Analysis and our Intraday Analysis for just the cost of the Daily Analysis alone.
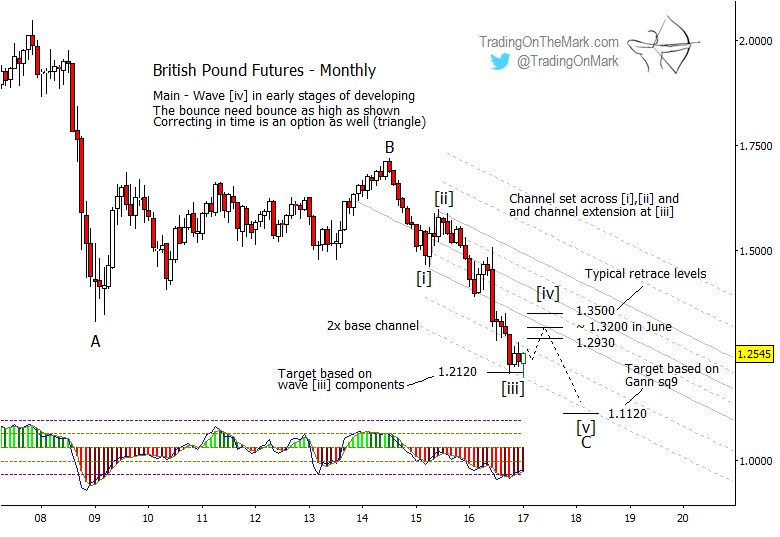
Combining the Elliott wave count with the channel drawn on the monthly chart above, we note that the Pound has found support during the last four months at a typical Fibonacci measurement of the internal moves of wave [iii]. Standard retracement ratios of wave [iii] suggest that the areas to watch for resistance include 1.2930 and 1.3500. We also will be watching price behavior if it tests the main channel boundary from below, which would be near 1.3200 in June.
When the decline resumes, perhaps around the middle of the year, we expect the Pound to reach for a new low. Another test of the channel harmonic is possible, and that might coincide with a test of a Gann square-of-nine support level at 1.1120.

