

I have been very bearish on soybeans for quite a while due to the fundamental setup. The USDA report on January 12th did show a large estimated drop in carryover from 460 ml/bushels to 405 ml/bushels, which fueled a voracious fund and short covering rally. On top of that, heavy rains in Argentina have reduced expected production by about 5% adding fuel to the fire. As a caveat, I find estimates of rain damage generally are way over rated (read my book). Also the world has been aggressively buying US beans again, exacerbating the rally. Demand has been strong.
However, while the carryover reduction estimate is a significant drop, it is still over double of what we have seen in over 10 years. Furthermore, the major season of US exports has now waned to South America. By this time of year USDA data has correctly pegged exports at 80%-90% of supply over the past decade. That leaves little upside in 2016/2017 soybean supply fundamentals. Given a strengthening dollar and very weak currencies in South America, the outlook for US competiveness in grain pricing is pretty poor.
Technically, if to not make the price situation worse, we are entering into what is termed the seasonal February break. I refer to it as the South American harvest low.
There has been an unusual chart pattern in soybean oil that has developed that I can’t ever remember seeing before. There is a longer-term head and shoulders pattern that has a smaller head and shoulders on its left. The unusual thing I find is this secondary pattern of the left shoulder. It is a head and shoulder itself (again supported by volume and symmetry). This morning from the left downside break of the neckline, the projected secondary objective was quickly reached.
The symmetry and volume are good to very good, suggesting these inter-related patterns are valid head and shoulder patterns
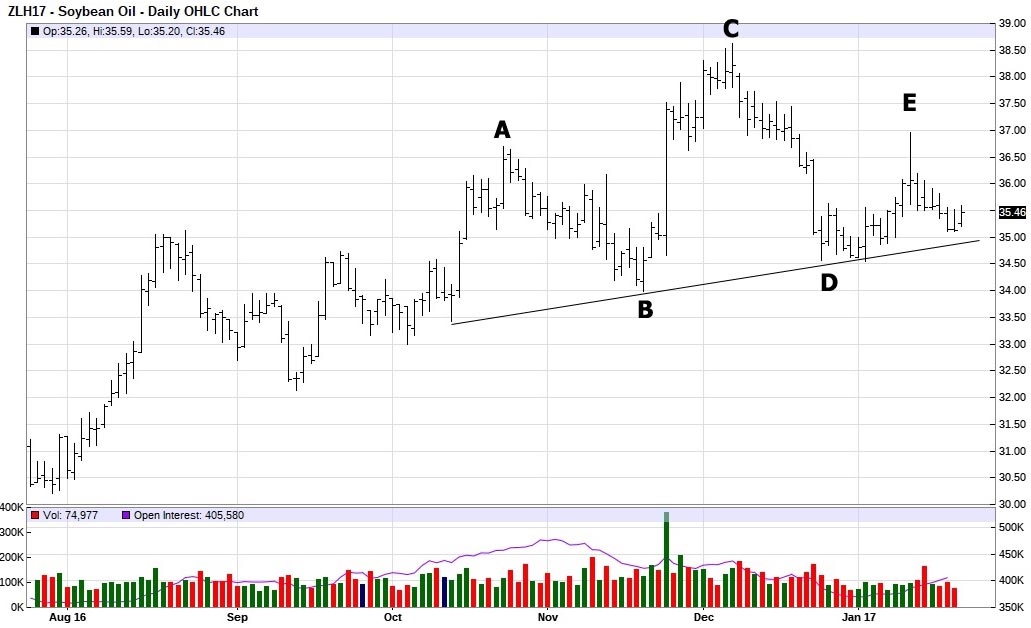
. I would have liked to see an extension at D to E that equals A and B. However, with the speed of information, events sometimes accelerate market reactions. A projection from the high day low at C (37.81) and the break below the neck line (34.20) projects a MINIMUM move down to about 31.40 in the March soyoil contract. Given the supply and demand fundamentals, I also expect an $8 handle on the March soybean contract.
Paul Kogut began working on the floor of the Chicago Board of Trade in 1973 as a summer clerk for his father, Leon. He has studied markets ever since. An expert at technical and fundamental analysis, he has developed over the years numerous trading systems and methods. His new book “To Be a Trader” is highlighted on his website http://becomeatrader.net.

