Dec. 30 (Bloomberg) — Companies in the U.S. expanded in December at the fastest pace in almost four years, signaling the economic recovery is gaining speed heading into 2010.
Dec. 30 (Bloomberg) — Most U.S. stocks retreated as investors speculated the Federal Reserve will withdraw stimulus measures amid growing evidence the economy is improving… Pessimism about U.S. stocks among newsletter writers fell to the lowest level since April 1987, six months before the 20 percent crash in the S&P 500 known as Black Monday.
We are, by nature, contrarian. We wish we weren’t because it makes life more difficult than it has to be at times. We are generally positive on the equity markets even though a contrary stance would take us over to the bearish camp. We take some solace from a report dated late last April from Merrill Lynch’s David Rosenberg arguing that sentiment was too positive on equities and negative on Treasuries. As usual the thundering herd has proved to be correct.
In any event… our point is that we are equity markets bullish. Why? Because, we suppose, the equity markets are on the rise. A second reason is that we have yet to find a good enough reason to change our minds. We wouldn’t be surprised if the stock markets opened the new year by shaking the tree somewhat but for the time being the trend still appears to be favorable.
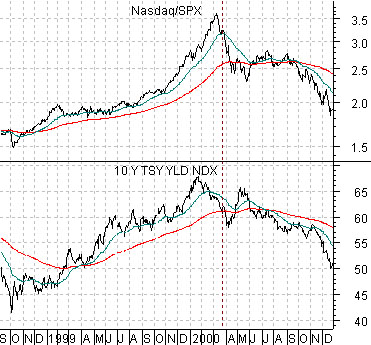
Below is a comparison between 10-year U.S. Treasury yields (TNX) and the ratio between the Nasdaq Comp. and the S&P 500 Index (SPX) from September 1998 through 2000. The argument is that the cyclical trend will remain positive as long as long-term yields are also trending higher. An early warning sign of problems to come showed up in March of 2000 as 10-year Treasury yields dived back below the 200-day moving average line.
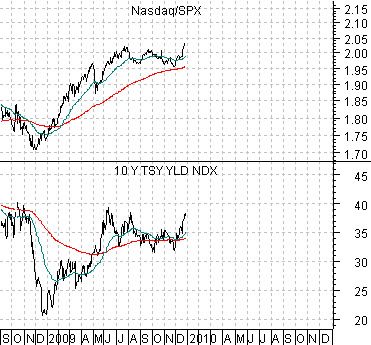
Below is the same comparison for the current time period. Notice that after dipping below the moving average line on a couple of occasions this past autumn the trend for yields has been higher through the month of December. As long as yields are on the high side of the moving average line we will argue that it is best to err on the side of optimism.
Many people love the agriculture sector and are apparently quite interested in being long grain futures and fertilizer stocks. Fair enough. The problem that we have with both trades is that they do not ‘fit’ our view of the intermarkets.
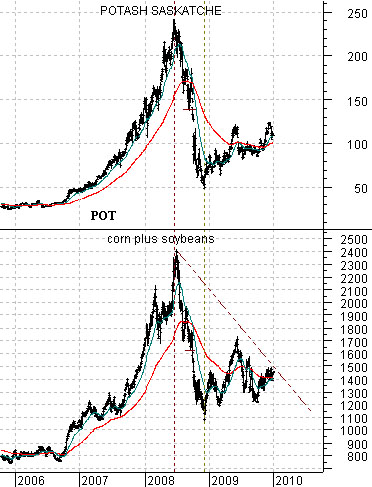
The chart below compares the share price of Potash (POT) with the sum of corn and soybean futures. Our argument is that the trends are almost identical and we will go so far as to suggest that neither is particularly positive at present.
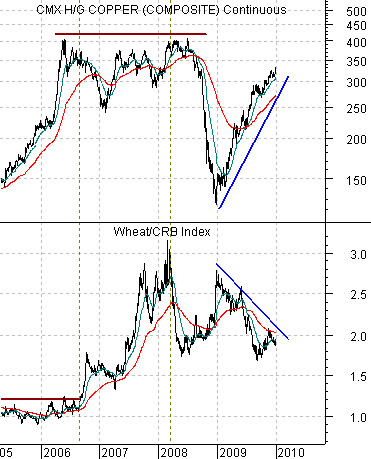
Below is a comparison between copper futures and the ratio between wheat futures and the CRB Index.
The point is that grains prices tend to underperform the CRB Index when copper prices are strong and rising. It wasn’t until copper finally peaked in 2006 that the wheat/CRB Index ratio turned strongly positive. Note how this impacted the share price of POT- the stock remained dormant through into late 2006 before swinging upwards into a rally that would see its price rise by close to 1000%. There may be another grains market looming on the horizon but our view is that it won’t start until copper prices finally get to some kind of top.
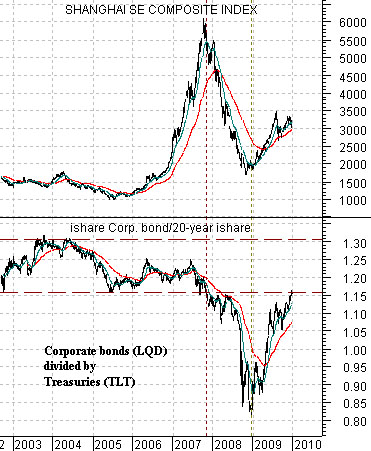
Below is a comparison between the Shanghai Comp. and the ratio between the corporate bond etf (LQD) and the long-term Treasury etf (TLT).
Between 2002 and late 2007 the LQD/TLT ratio traded between roughly 1.15:1 and just over 1.30:1. The chart suggests that this is a somewhat ‘normal’ range so when the ratio broke the bottom of the trading range in late 2007 it suggested trouble ahead. As long as corporates are rising relative to Treasuries it makes sense to remain positive on the equity markets as well.