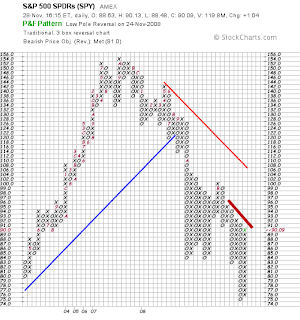
 The SPY is coming up to resistance on the point and figure. If it can break up two more boxes on heavy volume and maintain price above the current level, then going long may not be such a bad idea. Watch for a fall, though. |
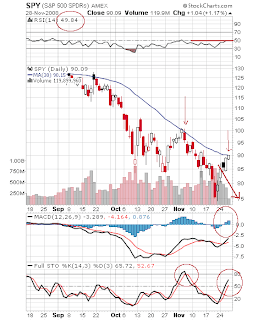
 Here’s a more verbose chart (can charts be verbose?). The SPY is coming up to the 30 day moving average, which has shown resistance before. If it manages to get above and close above on high volume, a long position would be a good. However, look at the falling volume (I know it is a holiday week, and that today was a half day, but that is all the more reason to be skeptical of the upward movement). This increase in price is not being driven by the exchange of many shares. The MACD turned positive, and the 5 day EMA has crossed the 10 day EMA, but I am skeptical that it will be able to hold; something to think about, because these are two signals that I consider when going long. RSI is almost 50. If it goes above 50, I’d forgo shorting, albeit, I am looking to buy some puts depending on Monday’s action. Take care. |
Uncategorized


