We were able to book some nice pips on the last leg down on the GU on Friday. We had a pretty good week overall.
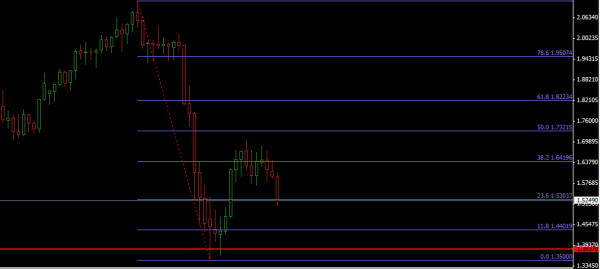
MONTHLY CHART: We are at a crucial point on the GU monthly chart. If price closes the month above the 5303 area then the GU could begin a nice retracement to the upside. So as we trade Sunday, we will keep that in mind.
Weekly and Daily Charts:
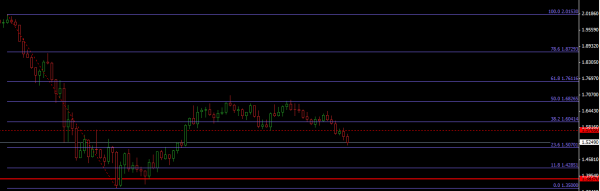
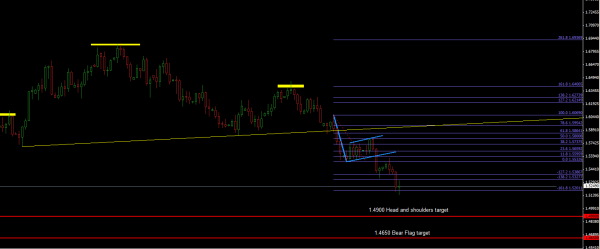
The weekly chart has not yet tested its 23.6 level at 5070 nor has the Daily chart tested the head and shoulders target or the bear flag target. As we are all aware of, the market moves in waves so we must ride those waves. We know that more than likely the targets WILL be met but we must figure out the waves in order to plan our entries. The daily closed friday with a doji so I am anticipating a pullback at least to the 5300 or better level before another wave down.
The weekly chart has not yet tested its 23.6 level at 5070 nor has the Daily chart tested the head and shoulders target or the bear flag target. As we are all aware of, the market moves in waves so we must ride those waves. We know that more than likely the targets WILL be met but we must figure out the waves in order to plan our entries. The daily closed friday with a doji so I am anticipating a pullback at least to the 5300 or better level before another wave down.
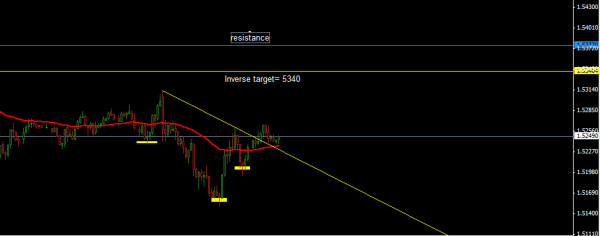
Now, we MUST pay attention to the possible clues the market gives us. We know the daily closed with a doji indicating indecision and also most likely a bit of a retracement.But how far could the daily retrace? Well, we are NEVER sure since the market is the only entity who knows for sure but we can observe the clues presented to us. So lets take a look at the 15 minute chart which has presented us with an inverse head and shoulders pattern. The target on the inverse of 5340 happens to be the low on Feb 19. Once 5340 was tested on 2/19, the pair rallied over 200 pips only to turn around, head back down and crack the 5340 area. So, in short, using these clues that the market provides will help us to determine OUR next moves in this market. They help us to plan our trades and trade our plan.