
By: Scott Redler and John Darsie
Some people like to say technical analysis is voodoo, that you could find any chart pattern on any stock at any time. They say fundamentals are the only way to finish ahead in the long run. Well I have a million examples of why they are dead wrong, including Goldman Sachs this year. Technical analysis is the most objective indicator because it simply lets the price action do the talking. We don’t always know why something is happening, and to be honest we don’t really care. You make money based on price action, period. We certainly didn’t have any advance knowledge that Goldman would be charged with fraud, but based on the chart over the last 12 months, we got the sense that something was very wrong.
Goldman, along with the rest of the banks, got crushed during the financial crisis of 2008, correcting from 2007 highs above $250 to less than $50 only a year later in late Fall 2008. It turned out to be the buying opportunity of a lifetime. During the subsequent rally, Goldman became a steadfast and reliable market leader along with AAPL. As traders, we looked to Goldman to confirm the strength of each leg higher in the markets. Then, in the Fall of 2009, something changed.
According to reports, Goldman was served with a Wells Notice in August of 2009. A Wells Notice is a notice from the SEC stating that a civil action may be brought against you in the near future. Goldman rallied with the rest of the market in September ’09, but topped out in October above $190. From that point forward, the market has been resilient, racing to new highs whenever the uptrend has come under threat. GS, meanwhile, has greatly underperformed.

This development made me, and others, scratch my head a little bit. We had to change our mindset towards Goldman, and simply let its chart tell us the real story. Something was wrong. The stock that was once the hallmark of this historic rally was lagging the market and the rest of the banking sector.
It seems clear to me that insiders became lukewarm towards the stock based on the impending threat of fraud charges from the SEC. Like the rest of the public, we didn’t know about the Wells Notice. We didn’t need to know about it. The truth was written on Goldman’s chart.
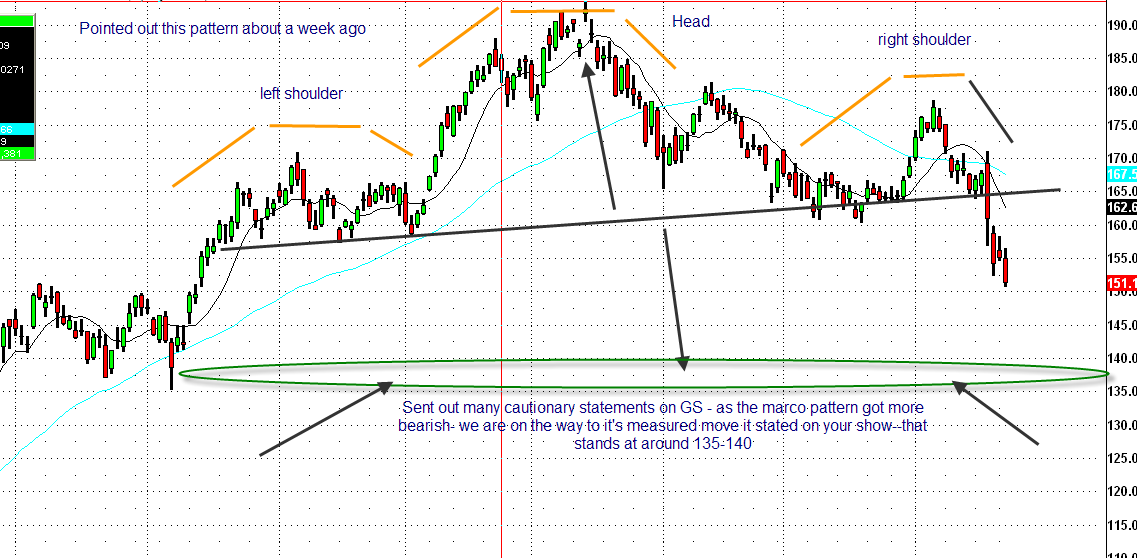
In early January, I sent out a number of cautionary notes on GS highlighting a head and shoulders pattern that could take the price as low as the 135-140 area. (See Charts Below)
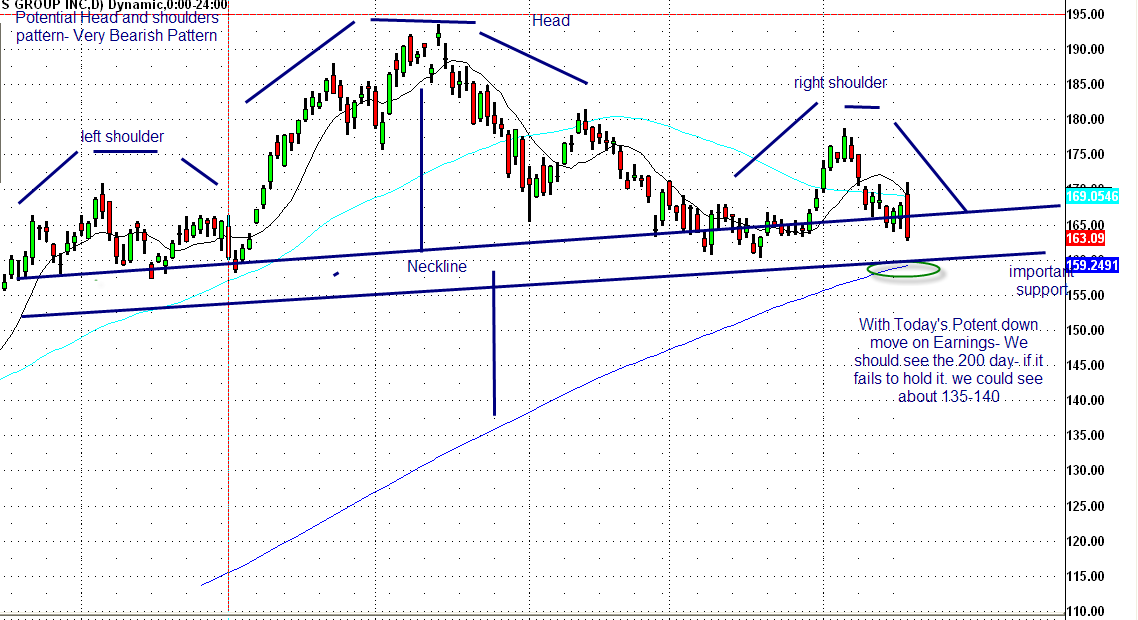
By no means am I saying we have been short Goldman through a neckline break of the 165 area. We would have (foolishly) held through a lot of pain if that was the case. We rode the quick trade into the 150 area and booked profits when the complexion changed. Although Goldman bounced as high as 185+, we never had it anywhere near a macro buy watchlist and had it on the radar as a future short. The technical damage was bubbling under the surface ready to erupt like the Iceland volcano. You never know what the catalyst will be, but you stay away from a volcano when earthquakes start shaking the ground all around you.
The fraud allegations broke on April 16th, and down goes Goldman, DOWN GOES GOLDMAN! News this morning that Goldman would also be investigated for possible criminal charges served as the knockout blow. The S&P downgraded GS today with a price target of 140. You’re a little late guys! That was my price target based on the chart pattern all the way back in January!
The moral of the story is: you can’t always know why, but you can see what is right in front of your face. We did not overanalyze Goldman’s relative weakness over the last year, we simply stayed away from it as a macro buy and put it on our radar for a possible short. Good technical trades always involve a catalyst. We didn’t know what that catalyst would be, but we got the sensational answer on April 16th. Goldman Sachs, the darling of Washington with former employees running the Treasury Department, finally got what had been a long-time coming. The American people finally got some sense of accountability from our government, and prudent active traders were laughing all the way to the bank.

