
Market Profile
Once trading begins, prices can move in any direction as the day progresses. During this time, prices will be at many different levels depending on the range of the day; essentially, the S&P futures can have a 5-point range or a 50-point range on any given day. In the early 80s, J. Peter Steidlmayer compared volume, also known as price action,with the time of the day in a graphical pattern he called the Market Profile™ (the Market Profile is a registered trademark of the CME Group). The Market Profile divides a day into thirty-minute segments and then distributes the price action into a graphic illustration with price as the vertical axis and time as the horizontal axis. The price action can be contract volume, tick volume, or both.
In a normalized statistical distribution, 70 percent of the value on a bell curve falls within one standard deviation of the average; in the Market Profile, this area is known as the value area. A value area is where roughly 70 percent of the trading volume took place during the last trading session. The upper range of the value area is known as the top of the value or value high (VH); the lower end of the value area is called the bottom of the value or value low (VL). When most of the price action is concentrated around a small range of prices, it is considered a single distribution day, forming one bell curve on the graph. When two bell curves are present, it means that price action settled at one price range, and then moved to another level, where the rest of the action was concentrated.This is known as a double distribution day. The Market Profile assigns a letter to each thirty-minute
segment within a calendar day. All the trades that occur within one thirty-minute segment are symbolized by one letter. The price with most letters is called the Point of Control. (For more information refer to Minds Over Markets by James Dalton,Trading with Market Profile by Steidlmayer, and the CME)
|
|
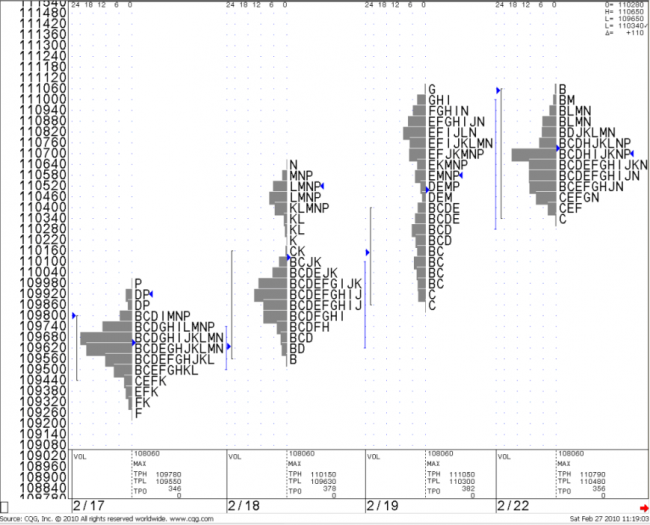
Above is a Market Profile on a CQG Chart. On 2/17 and 2/22 you can see a single distribution day with a single bell curve. On 2/18, you will notice a double distribution day with two bell curves. Here, the price is moving from one level to another later in the day. On 2/19, the bottom long tail is more or less market noise. Most of the action took place between 110300 and 111050 (the intraday low was 109900 and the high was 111100). The top of the value area, VH, and the bottom of the value area, VL, are considered support and resistance areas.For our trading purposes, we are interested in the top and bottom of the value areas. As ashort-term trader, you know what to do at those levels. Managing the trade will contributegreatly to your success. |
|
Let’s look at how we can use the Market Profile as a support and resistance indicator. 1.Opening above top of the value |
|

|
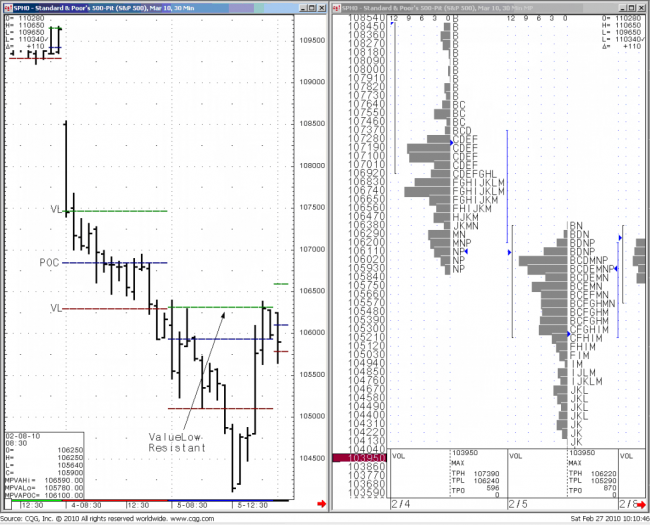
2. Opening below the bottom of the value When today’s opening price is below the bottom of the value of the last trading day’s profile, the last trading day’s bottom can be used as resistance. |
|
|
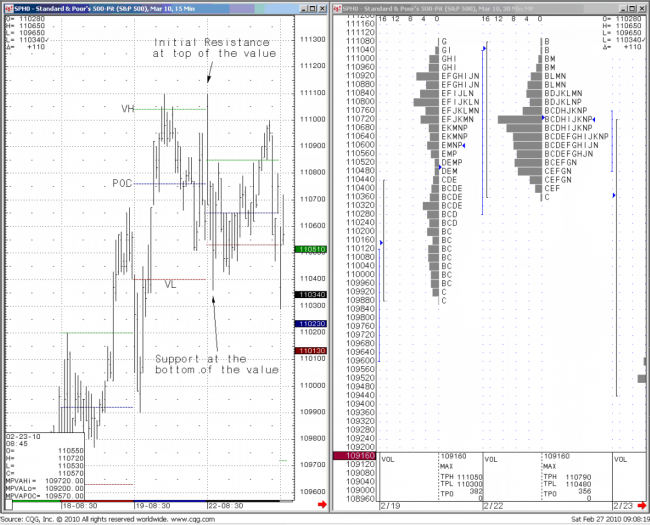
3.Opening inside the value area When today’s open is inside the last session’s value area, the top of the value area can be used as resistance, and the bottom of the value area can be used as support. |
|
In summary, during the trading day, VH and VL can be used as support, resistance or both. If the opening price is above VH, VH can initially act as support. If the price breaks below VH, then VH should be used as resistance. If the opening price is below the VL, VL should act as resistance. If the price rallies above the VL, then VH should be treated as the next level of resistance. If the price continues to drop, then the next level is VL, which will be expected to act as support. As you probably already know, these are the expectations of a market participant and there is no guarantee that those levels will act as anticipated.
_________________________________________________________________________________________________
Please join us for a FREE webinar on Market Profile by clicking here
Opinions expressed are subject to change without notice. This report should not be construed as a request to engage in any transaction involving the purchase or sale of a futures contract and/or commodity option thereon. The risk of loss in trading futures contracts or commodity options is substantial, and investors should carefully consider the inherent risks of such an investment in light of their financial condition. There is a substantial risk of loss in trading futures, options and retail off-exchange foreign currency. Only risk capital should be used. You should carefully take into consideration your knowledge and financial resources to determine whether trading is suitable for you. You may lose all or more of your initial investment. Past performance is not indicative of future results.

