

This article is the first part of an on-going series that I will provide on the Elliott Wave Principle. I will try and keep them simple and to the point, once I have covered the patterns rules and guidelines I will focus on the common pitfalls new traders to the Wave Principle encounter and how to overcome them. Should you have any questions I can be contacted at michael@elliottwaveireland.com, let’s start with a brief introduction.
Who is Elliott?
The Elliott Wave Principle (EWP) was discovered by Ralph Nelson Elliott in the 1930’s. An accomplished accountant by profession he was forced into early retirement at the age of 58 due to an illness contracted while living in Central America.
Needing something to occupy his mind while recuperating, he turned his full attention to studying the behaviour of the stock market. It was through this time that he put together principles of a wave structure that he observed to be unfolding in real time throughout the stock market. T
here were other market technicians at the time who were also aware and trying to formulate theories of trend fluctuations (Charles Dow and WD Gann) but it is the order and complexity of the Wave Principle that set Nelson’s theory apart from others, even to this day.
As a result of Elliott’s pioneering research, today, thousands of institutional portfolio managers, traders and private investors use the Wave Theory in their investment decision-making. Now let me get one small bee out of the bonnet. There are some wave practitioners that claim to have found additions to or new practices to the wave principle.
This does not mean that their approach to wave analysis is incorrect but it should always be made clear that once you stop adhering to the rules and guidelines lines set out by R N Elliott you are no longer practicing the WP but something entirely different. Those interested in more of the history on Elliott should read R.N. Elliott’s Masterworks (New Classics Library, 1994)
The Theory
The Elliott Wave Principle is a detailed description of how groups of people behave. It reveals that mass psych
ology swings from pessimism to optimism and back in a natural sequence, creating specific and measurable patterns. One of the best places to see the Elliott Wave Principle at work is in the financial markets, where changing investor psychology is recorded in the form of price movements.
The Elliott Wave Principle measures investor psychology, which is the real engine behind the stock markets. When people are optimistic about the future of a given issue, they bid the price up. When they are pessimistic they bid the price down. If you can identify repeating patterns in prices, and figure out where we are in those repeating patterns at any time, therefore you can predict with reasonable probability where we will go next.
Think Five’s and Three’s
The Elliott Wave Principle works by identifying patterns in market prices, also referred to analysing waves. Elliott’s Wave Principle (WP) consists of “Impulsive waves” and “Corrective waves.” An impulsive wave is composed of five subwaves (denoted by numbers). It moves in the same direction as the trend of the next larger size. A corrective wave is divided into three subwaves (denoted by letters). It moves against the trend of the next larger size.
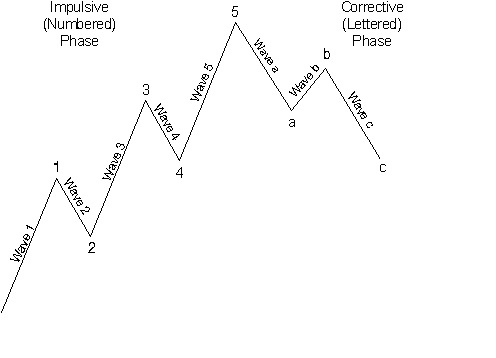
As the figure below shows, these basic patterns build to form five and three-wave structures of increasingly larger size, known as degrees of trend. A complete Elliott Wave pattern has 8 waves: 5 during the “impulse” phase and 3 during the “corrective” phase.
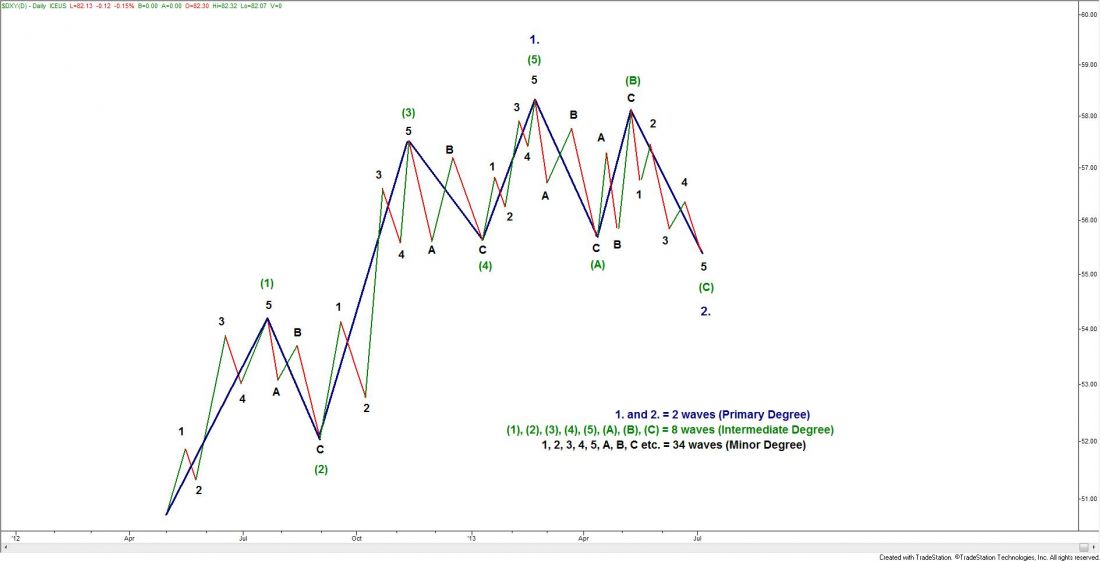
In the above diagram, waves 1, 2, 3, 4 and 5 together complete a larger impulsive sequence, labelled wave (1). The impulsive structure of wave (1) tells us that the movement at the next larger degree of trend is also upward. It also warns us to expect a three-wave correction — in this case, a shorter term downtrend. That correction, wave (2), is followed by waves (3), (4) and (5) to complete an impulsive sequence of the next larger degree, labelled as wave 1.
At that point, again, a three-wave correction of the same degree occurs, labelled as wave 2. The structures Elliott described also meet the common definition of a fractal, self-similar patterns appearing at every degree of trend. Just as naturally-occurring fractals often expand and grow more complex over time the wave principle falls into this category known as robust fractal.
Application
In applying the Elliott Wave Principle, our first task is to look at charts of market action and identify any completed five-wave and three-wave structures. Only then can we interpret where the market is and where it’s likely to go. This is often referred to “Big Picture” outlook.
As with any methodology used to help forecast market direction, the Elliott Wave Principle does not provide certainty about any one market outcome. Instead, it gives you an objective means of determining the probability of a future direction for the market. At any time, two or more valid wave interpretations usually exist. So, it’s important for any investor or trader to carefully assess the probability of each interpretation.
Wave interpretation rules and Fibonacci relationships together are powerful tools for establishing investment strategies and more importantly reducing risk exposure. Applying the EWP aids investors in deciding where to get in, where to get out (with both stops and targets) and at what point to give up on a strategy. This alone provides the backbone to a successful trading plan in itself.
Check back next month! Next we will look at the internal patterns that make up the Impulsive waves and the Corrective waves.

