

Directional Movement Index, which with the ADX indicator measures the “trendiness” of a market without regard to whether the trend is up or down.
Background: The Directional Movement Index (DMI) and the Average Directional Index (ADX) were introduced by J. Welles Wilder in his book, New Concepts in Trading Strategies, in 1978.
Purpose: DMI measures the strength of a market trend, whether that trend is positive or negative. DMI is essentially an oscillator moving between 0 and 100 based on +DMI, which measures upward price movement, and -DMI, which measures downward price movement. The ADX uses the difference in +DMI and -DMI to show how trendy a market is, smoothing out the data with a moving average to put a number on the strength of a trend.
Basic signals: Directional Movement compares the current period’s high with the previous period’s high and the current period’s low with the previous period’s low. Use only the larger value. If that is the difference between the highs, the number goes in the +DMI column; if the larger value is between the lows, the number goes in the -DMI column.
DMI can be used in several ways, but the most common involve crossovers of the +DMI and -DMI readings, differences between the two readings and movements from extreme levels. When +DMI crosses above -DMI, take a long position; when -DMI falls below +DMI, exit the long position and go short.
Many traders focus only on the ADX line. To calculate ADX, find the average of the differences between +DMI and -DMI for a selected period and then add a smoothing moving average to come up with a reading for trend strength. If the ADX is above 30, it suggests the market is in a strong trend with either bulls or bears in firm control. If the ADX line is below 30, it indicates prices are chopping around and the trend is not strong.
High ADX readings indicate a trader should be using trend-following trading techniques. Low ADX readings suggest traders should be using techniques for trading range markets.
The ADX can also provide a hint that a trend may be overdue for a turn. If ADX rises above 40-45, it suggests a strong trend that is reaching overbought or oversold conditions and is unlikely to get even stronger as no market goes in one direction forever.
Pros/cons: DMI and ADX present a number of squiggly lines to analyze but do provide a quick way to see whether a market is in a trending or non-trending pattern, which can help the trader decide which type of trading approach might be the most effective in current conditions. However, when the indicators do show a trending situation, they do not indicate the direction of the trend.
Source: eSignal
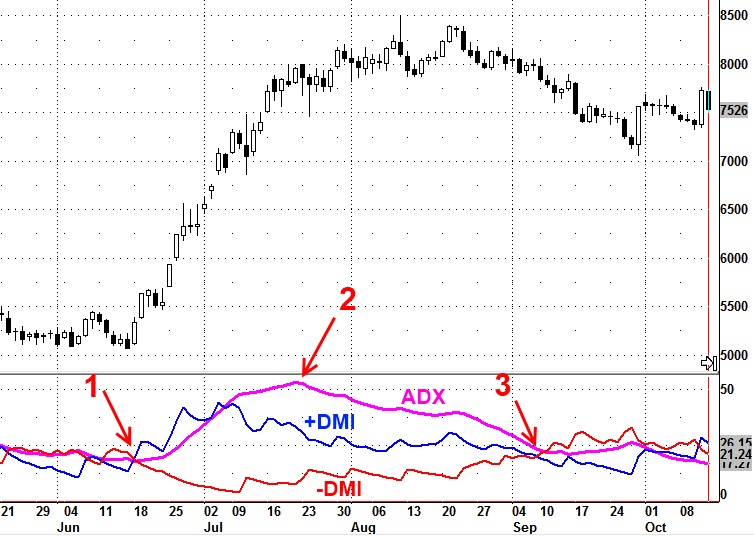
When +DMI (blue line) crossed above -DMI (red line) in June (1), it was a clue to go long. As the price trend strengthened, the ADX reading moved above 50 (2), an unusually high reading that warned the market was overbought and the trend might be susceptible to a correction. The difference between +DMI and -DMI began to narrow, leading the ADX to decline. When the -DMI line crossed above the +DMI line in September (3), it indicated it was time to exit the long position and go short, depending on clues from other indicators.

